This site uses cookies to improve your experience. To help us insure we adhere to various privacy regulations, please select your country/region of residence. If you do not select a country, we will assume you are from the United States. Select your Cookie Settings or view our Privacy Policy and Terms of Use.
Cookie Settings
Cookies and similar technologies are used on this website for proper function of the website, for tracking performance analytics and for marketing purposes. We and some of our third-party providers may use cookie data for various purposes. Please review the cookie settings below and choose your preference.
Used for the proper function of the website
Used for monitoring website traffic and interactions
Cookie Settings
Cookies and similar technologies are used on this website for proper function of the website, for tracking performance analytics and for marketing purposes. We and some of our third-party providers may use cookie data for various purposes. Please review the cookie settings below and choose your preference.
Strictly Necessary: Used for the proper function of the website
Performance/Analytics: Used for monitoring website traffic and interactions
Thus, as you peruse my historical data on implied equity riskpremiums or PE ratios for the S&P 500 over time, you may be tempted to compute averages and use them in your investment strategies, or use my industry averages for debt ratios and pricing multiples as the target for every company in the peer group, but you should hold back.
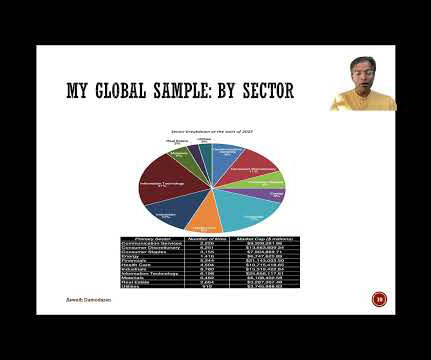
Breaking down just US equities, by sector, we can see the damage across sectors: The technology sector lost the most in value last week, both in dollar terms, shedding almost $1.8 There was undoubtedly some panic selling on Friday, but the flight to safety, whether it be in moving into treasuries or high dividend paying stocks, was muted.
In the first five posts, I have looked at the macro numbers that drive global markets, from interest rates to riskpremiums, but it is not my preferred habitat. The second set of inputs are prices of risk, in both the equity and debt markets, with the former measured by equity riskpremiums , and the latter by default spreads.
The first is that it was an uneven recovery, if you break stocks down be sector, which I have, for both US and global stocks, in the table below: As you can see, technology was the biggest winner of the year, up almost 58% (44%) for US (global) stocks, with communication services and consumer discretionary as the next best performers.
Relative Risk Measures Before we embark on how to measure relative risk, where there can be substantial disagreement, let me start with a statement on which there should be agreement. Technology and cyclical companies dominate raw highest risk rankings.
In my second data update post from the start of this year , I looked at US equities in 2022, with the S&P 500 down almost 20% during the year and the NASDAQ, overweighted in technology, feeling even more pain, down about a third, during the year.
When valuing or analyzing a company, I find myself looking for and using macro data (riskpremiums, default spreads, tax rates) and industry-level data on profitability, risk and leverage. I do report on a few market-wide data items especially on riskpremiums for both equity and debt. Goodwill & Impairment 4.
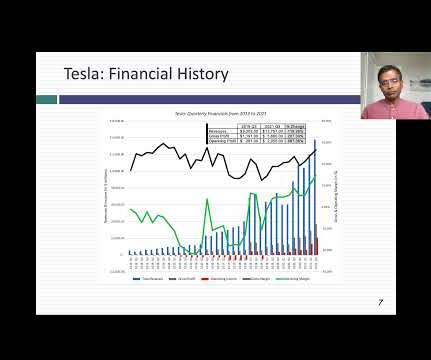
I would be lying if I said that I have had clarity about Tesla's story over the last decade, because it has so many tangents, distractions and shifts along the way, flirting with narratives about being a battery company, an energy company and a technology company. for mature markets.
By focusing so much attention on a small subset of companies, you risk developing tunnel vision, especially when doing peer group comparisons. In the same dataset where I compute historical equity riskpremiums, I report historical returns on corporate bonds in two ratings classes (Moody’s Aaa and Baa ratings).
In my last three posts, I looked at the macro (equity riskpremiums, default spreads, risk free rates) and micro (company risk measures) that feed into the expected returns we demand on investments, and argued that these expected returns become hurdle rates for businesses, in the form of costs of equity and capital.
Thus, you and I can disagree about whether beta is a good measure of risk, but not on the principle that no matter what definition of risk you ultimately choose, riskier investments need higher hurdles than safer investments.
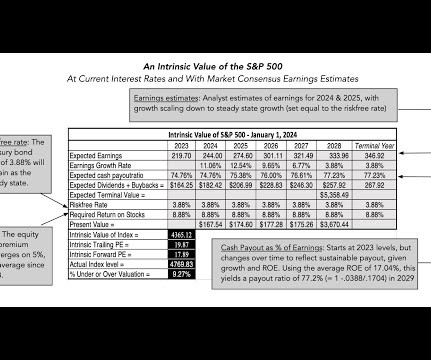
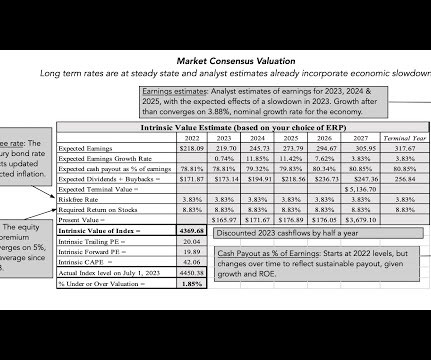
When you augment this price change with the dividends on the index during 2021, the total return on the S&P 500 for 2021 was 28.47%. With equities, the cash flows take the form of dividends and buybacks, and in addition to estimating them using future growth rates, you have to assume that they continue in perpetuity.
I use the data through the end of 2023 to compute all three measures for every company, and in my first breakdown, I look at these risk measures, by sector (globally): Utilities are the safest or close to the safest , on all three price-based measures, but there are divergences on the other risk measures.
Most of the variables that I report are micro variables, relating to company choices on investing, financing and dividend policies, or to data that may be needed to value these companies. I extend my equity riskpremium approach to cover other countries, using sovereign default spreads as my starting point, at this link.
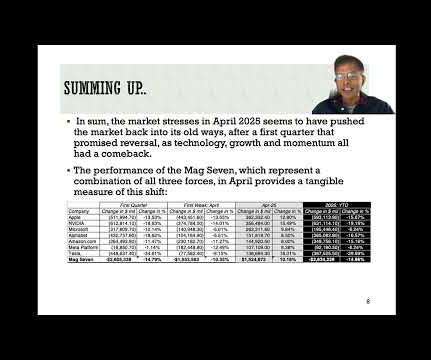
At the start of the month, as has been the case for much of the last decade, the focus was on technology, partly because of its large weight in overall equity value at the start of 2025, and partly because of the punishment meted out to tech stocks during the first quarter of the year. trillion that they lost in the first week of the month.
Equity is cheaper than debt: There are businesspeople (including some CFOs) who argue that debt is cheaper than equity, basing that conclusion on a comparison of the explicit costs associated with each interest payments on debt and dividends on equity.
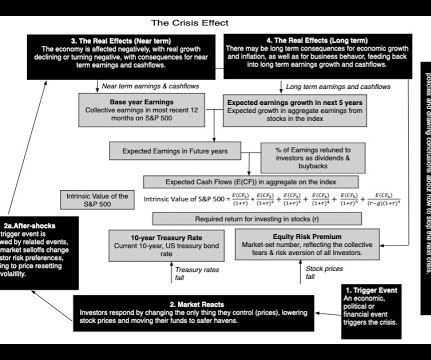
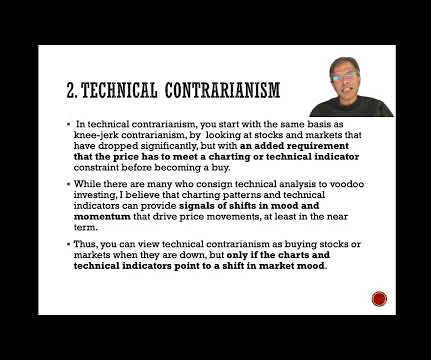
Instead, you will have to revalue the company, with adjustments to expected cash flows and riskpremiums, given the crisis, and if that value exceeds the price, you should buy the stock. Contrarian Investing: The Psychological Tests! In the abstract, it is easy to understand the appeal of contrarian investing.
Thus, my estimates of equity riskpremiums, updated every month, are not designed to make big statements about markets but more to get inputs I need to value companies. That said, to value companies today, I have no choice but to bring in the economics and politics of the world that these companies inhabit.
We organize all of the trending information in your field so you don't have to. Join 8,000+ users and stay up to date on the latest articles your peers are reading.
You know about us, now we want to get to know you!
Let's personalize your content
Let's get even more personalized
We recognize your account from another site in our network, please click 'Send Email' below to continue with verifying your account and setting a password.


Let's personalize your content