This site uses cookies to improve your experience. To help us insure we adhere to various privacy regulations, please select your country/region of residence. If you do not select a country, we will assume you are from the United States. Select your Cookie Settings or view our Privacy Policy and Terms of Use.
Cookie Settings
Cookies and similar technologies are used on this website for proper function of the website, for tracking performance analytics and for marketing purposes. We and some of our third-party providers may use cookie data for various purposes. Please review the cookie settings below and choose your preference.
Used for the proper function of the website
Used for monitoring website traffic and interactions
Cookie Settings
Cookies and similar technologies are used on this website for proper function of the website, for tracking performance analytics and for marketing purposes. We and some of our third-party providers may use cookie data for various purposes. Please review the cookie settings below and choose your preference.
Strictly Necessary: Used for the proper function of the website
Performance/Analytics: Used for monitoring website traffic and interactions
Definition of EBIT Margin. EBIT margin stands for Earning Before Interest and Tax margin. The higher the EBIT the better it is for the firm. What is the Formula for the EBIT Margin? EBIT margin is calculated by dividing EBIT by revenue. EBIT margin = EBIT / Revenue . EBIT Margin in Practice.
Definition of EBIT Return on Assets. EBIT return on asset measures the firm’s earnings before interest and tax with respect to the firm’s total asset. The reason EBIT is used and not net income is because EBIT focuses only on operating cash flows. . What is the Formula for EBIT Return on Assets? EBIT = Revenue ?
EBIT and EBITDA are two measurements of business profitability. This article will discuss two accounting terms used to build the FCFF - EBIT and EBITDA (Earnings Before Interest, Taxes, Depreciation, and Amortization). Both EBIT and EBITDA are indicators of the firm's profitability. . What is EBIT? Let's discuss. . .
If you’re interested in selling your business, you may be doing some research on how businesses are valued. There are lots of misleading theories out there about how to best value a business, including using a multiple of revenue (not good) or a multiple of net profit (even worse).
NOPAT can be calculated through the following formula: EBIT x (1 – tax rate). EBIT is the earnings before interest and tax. To find the ROIC, you divide NOPAT by Invested Capital. NOPAT ÷ Invested Capital. The NOPAT is the net operating profit after tax. ROIC in Practice. Tony wanted to open up a shop that sells shoes.
Also Read: Disney Scrutinizing its TV Network Portfolio ValueAct notes that Disney's theme parks and consumer products businesses and their $10 billion in EBIT are alone. ValueAct Capital began buying Disney in 2023 summer during the Hollywood strikes, and it is now one of the largest shareholders, CNBC cites Activist Spotlight.
Adjusted EBIT increased 18% Y/Y to $392 million, with margin expanding to 17% from 15% prior year quarter. Sales by segments : Composites $514 million (-13% Y/Y), Insulation $931 million (-3% Y/Y), and Roofing $928 million (+16% Y/Y). Adjusted EPS was $3.21, up from $2.49 a year ago, above the consensus of $2.86. Adjusted EBITDA rose by.
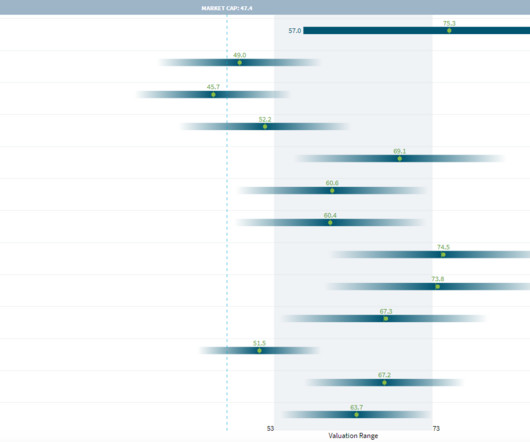
billion with EBIT margin increasing to 16.6% The Trading Comparables analysis resulted in a valuation range of CHF 47 to 83 billion, by applying the observed trading multiples EV/EBITDA, EV/EBIT and P/E. ABB’s order intake rose 4% to CHF 7.9 billion, the company said in its third-quarter press release. Sales rose 5% to CHF 7.1
billion with EBIT margin increasing to 16.6% The Trading Comparables analysis resulted in a valuation range of CHF 47 to 83 billion, by applying the observed trading multiples EV/EBITDA, EV/EBIT and P/E. ABB’s order intake rose 4% to CHF 7.9 billion, the company said in its third-quarter press release. Sales rose 5% to CHF 7.1
The trading comparables approach confirms this view with the median EV/EBITDA, EV/EBIT and P/E multiples applied to the 2023 forecasts producing a valuation range of USD 600 million to USD 1.1 While the current market capitalisation was USD 1.42 billion.
A useful tip is to check for consistency between the forecast margins and historical margins—EBITDA margin, EBIT margin, and Net Income margin. Hockey stick-like growth in your DCF projections may indicate these projections are not realistic.
In practice, professionals rely on several results, assessed at different levels of the income statement: - the gross operating surplus (EBIT or EBITDA) - net operating surplus (ENE or EBIT) - the Current Result Before Tax (RCAI) - Net Income (NR) - Self-Financing Capacity (CAF) or operating cash flow. EBITDA and EBIT).
In the fo rmer, we compared Porsche with peers such as BMW, Mercedes-Benz, Ferrari and Ford using thethe EV/EBITDA and the EV/EBIT multiples. We have performed a Trading Comparables analysis and a discounted cash flow using the Flow to Equity Approach. Our result suggests a valuation range of €74 billion to € 96 billion.
EBIT margin is likely to expand significantly through better cost control. We see an EBIT margin around 15% as a maximum for this Ralph Lauren. After the revenue rebound in 22E, we assume revenue growth to normalize. Going forward, we see the revenue growth potential between 3-4%. So, we already have an optimistic bias.
EBIT margin expansion in 22E probably only short-lived. Going forward, we see the EBIT margin to range between 7-8%. After the revenue rebound in 22E, we assume revenue growth to normalize. Going forward, we see poor revenue growth potential between 2-3%. Long-term share price performance potential. Free cash flow – Kohl’s.
An example of an enterprise multiple: EV/Sales, EV/EBITDA, EV/EBIT and practically all non-financial multiples (e.g. Note that, because the impact of debt (in the form of interest), falls below EBIT on the P&L, typically any metric below that would be an equity metric and any metric above that would be an enterprise metric.
An example of an enterprise multiple: EV/Sales, EV/EBITDA, EV/EBIT and practically all non-financial multiples (e.g. Note that, because the impact of debt (in the form of interest), falls below EBIT on the P&L, typically any metric below that would be an equity metric and any metric above that would be an enterprise metric.
If it can maintain a 6-7% EBIT margin it changes the market’s assessment of the company. If it can maintain a 6-7% EBIT margin, then this could be a catalyst for share price performance. Mainly from fierce price competition, higher labor costs and the recent chip shortage. Reducing reliance on global supply chains. P&L – Hyundai.
billion by applying the observed trading multiples EV/Sales, EV/EBITDA, EV/EBIT, P/E and P/B. The Discounted Cash Flow analysis produced a value of CAD 14.7 billion using a WACC of 8.8%. The Trading Comparables analysis resulted in a valuation range of CAD 6.4 billion to CAD 28.1 and Peninsula Energy Limited. billion to CAD 19 billion.
billion by applying the observed trading multiples EV/Sales, EV/EBITDA, EV/EBIT and P/E. The Discounted Cash Flow analysis produced a value of USD 27.1 billion using a WACC of 11.7%. The Trading Comparables analysis resulted in a valuation range of USD 27.1 billion to USD 35.4 Earthstone Energy, Inc. and Northern Oil and Gas, Inc.
The Trading Comparables analysis resulted in a valuation range of $257 billion to $296 billion by applying the observed trading multiples EV/EBITDA, EV/EBIT and P/E. The Flow-to-Equity analysis produced a value of $308 billion using a Cost of Equity of 9.2%.
The Trading Comparables analysis resulted in a valuation range of $81 to $158 billion, by applying the observed trading multiples EV/EBITDA, EV/EBIT and P/E. The Discounted Cash Flow analysis produced a value of $99.5 billion using a WACC of 9.7%. For our Trading Comparables we selected similar peers such as SAP and Microsoft.
The Trading Comparables analysis resulted in a valuation range of $81 to $158 billion, by applying the observed trading multiples EV/EBITDA, EV/EBIT and P/E. The Discounted Cash Flow analysis produced a value of $99.5 billion using a WACC of 9.7%. For our Trading Comparables we selected similar peers such as SAP and Microsoft.
To double-check for this possibility, we test for the difference in the change in the ratio of earnings before interest and taxes (EBIT) to total assets from pre- to post-quota between firms regulated and not regulated by the quota law, covering the period 2001-2013.
billion to USD 108 billion by applying the observed trading multiples EV/Sales, EV/EBITDA, EV/EBIT and P/E. The Discounted Cash Flow analysis produced a value of USD 212 billion using a WACC of 6.8%. The Trading Comparables analysis resulted in a valuation range of USD 57.2 Scandinavian Tobacco Group A/S and Vector Group Ltd.
billion by applying the observed trading multiples EV/Sales, EV/EBITDA, EV/EBIT and P/E. The Discounted Cash Flow analysis produced a value of USD 21.8 billion using a WACC of 10%. The Trading Comparables analysis resulted in a valuation range of USD 15.5 billion to USD 32.3 Energy Transfer L.P. and Plains All American Pipeline, L.P.
billion by applying the observed trading multiples EV/Sales, EV/EBITDA, EV/EBIT and P/E. The Discounted Cash Flow analysis produced a value of USD 75.3 billion using a WACC of 6.3%. The Trading Comparables analysis resulted in a valuation range of USD 45.7 billion to USD 74.5 The Simply Good Foods Company and Campbell Soup Company.
billion by applying the observed trading multiples EV/Sales, EV/EBITDA, EV/EBIT and P/E. The Discounted Cash Flow analysis produced a value of USD 75.3 billion using a WACC of 6.3%. The Trading Comparables analysis resulted in a valuation range of USD 45.7 billion to USD 74.5 The Simply Good Foods Company and Campbell Soup Company.
The Trading Comparables analysis resulted in a valuation range of €305 billion to €492 billion by applying the observed trading multiples EV/Sales, EV/EBITDA, EV/EBIT and P/E. The Discounted Cash Flow analysis produced a value of €330 billion using a WACC of 9.3%.
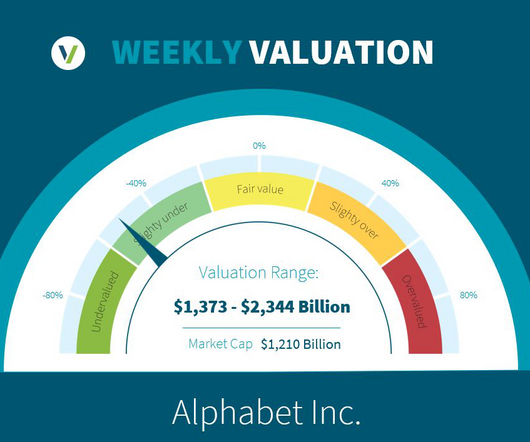
The Trading Comparables analysis resulted in a valuation range of $1,517 billion to $2,344 billion by applying the observed trading multiples EV/EBITDA, EV/EBIT and P/E. The Discounted Cash Flow analysis produced a value of $1,373 billion using a WACC of 9.9%.
The Trading Comparables analysis resulted in a valuation range of $83 billion to $118 billion, by applying the observed trading multiples EV/EBITDA, EV/EBIT and P/E. The Discounted Cash Flow analysis produced a value of $68.6 billion using a WACC of 8%. . For our Trading Comparables we selected similar peers such as McDonald’s, Yum!
The Trading Comparables analysis resulted in a valuation range of $202 billion to $231 billion, by applying the observed trading multiples EV/EBITDA, EV/EBIT and P/E. The Discounted Cash Flow analysis produced a value of $230 billion, with a WACC of 8.8%. .
The Trading Comparables analysis resulted in a valuation range of USD 503 billion to USD 812 billion by applying the observed trading multiples EV/Sales, EV/EBITDA, EV/EBIT and P/E. The Discounted Cash Flow analysis produced a valuation range of USD 370 billion to USD 493 billion using a WACC of 12.9%. Microsoft Corporation.
The Trading Comparables analysis resulted in a valuation range of USD 60 billion to USD 277 billion by applying the observed trading multiples EV/Sales, EV/EBITDA, EV/EBIT and P/E. The Discounted Cash Flow analysis produced a value of USD 267 billion using a WACC of 13.6%. and Cisco Systems, Inc.
The Trading Comparables analysis resulted in a valuation range of USD 106 billion to USD 235 billion by applying the observed trading multiples EV/Sales, EV/EBITDA, EV/EBIT and P/E. The Discounted Cash Flow analysis produced a value of USD 222 billion using a WACC of 6.4%. and Alphabet Inc.
The Trading Comparables analysis resulted in a valuation range of GBP 98 (USD 199) billion to GBP 137 (USD 166) billion by applying the observed trading multiples EV/EBITDA, EV/EBIT, P/E and P/B. For our Trading Comparables we selected similar peers such as Total Energies, Shell, Chevron and Saudi Arabien Oil Company.
billion to HKD 3,905 (USD 501) billion, by applying the observed trading multiples EV/EBITDA, EV/EBIT and P/E. The Trading Comparables analysis resulted in a valuation range of HKD 1,752 (USD 221.5) For our Trading Comparables we selected similar peers such as Alibaba, NetEase and Meta Platforms. billion to HKD 3,905 (USD 501) billion.
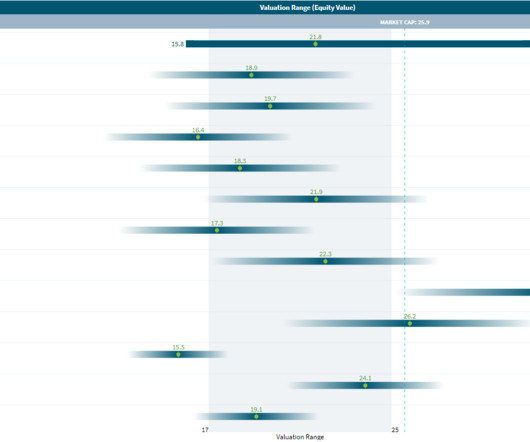
We came up with this valuation range by using the observed trading multiples EV/EBITDA, EV/EBIT and P/E of peers such as Nike and Puma. . The Trading Comparable analysis shows a completely different picture for the valuation of Adidas, as it suggests a value between €15.6 billion and €26.2 billion to €44.9
We organize all of the trending information in your field so you don't have to. Join 8,000+ users and stay up to date on the latest articles your peers are reading.
You know about us, now we want to get to know you!
Let's personalize your content
Let's get even more personalized
We recognize your account from another site in our network, please click 'Send Email' below to continue with verifying your account and setting a password.


Let's personalize your content