This site uses cookies to improve your experience. To help us insure we adhere to various privacy regulations, please select your country/region of residence. If you do not select a country, we will assume you are from the United States. Select your Cookie Settings or view our Privacy Policy and Terms of Use.
Cookie Settings
Cookies and similar technologies are used on this website for proper function of the website, for tracking performance analytics and for marketing purposes. We and some of our third-party providers may use cookie data for various purposes. Please review the cookie settings below and choose your preference.
Used for the proper function of the website
Used for monitoring website traffic and interactions
Cookie Settings
Cookies and similar technologies are used on this website for proper function of the website, for tracking performance analytics and for marketing purposes. We and some of our third-party providers may use cookie data for various purposes. Please review the cookie settings below and choose your preference.
Strictly Necessary: Used for the proper function of the website
Performance/Analytics: Used for monitoring website traffic and interactions
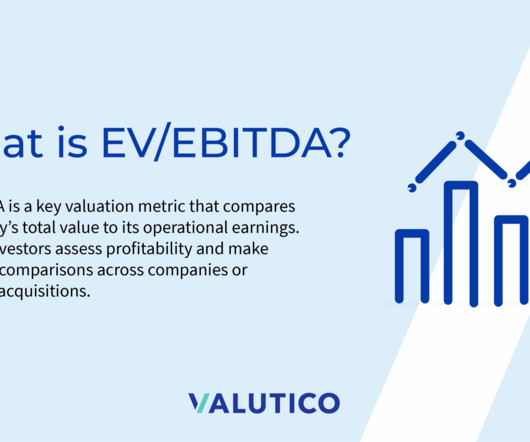
EV typically includes MarketCapitalization, Debt, Minority Interest, and Preferred Equity, minus Cash & Cash Equivalents. A primary advantage is providing a “debt-neutral” valuation, making comparisons easier between companies with different capital structures.
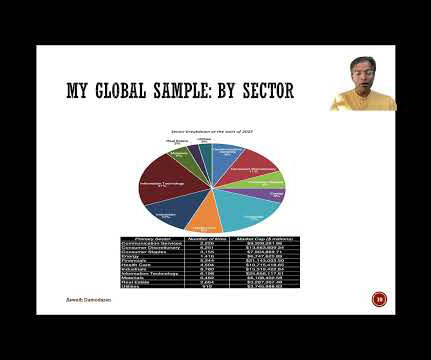
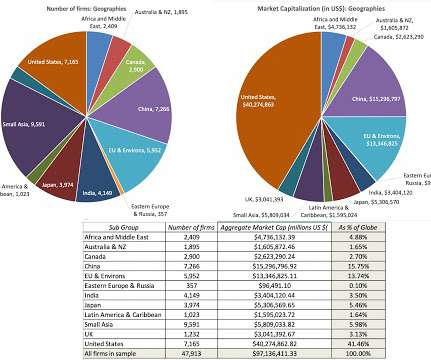
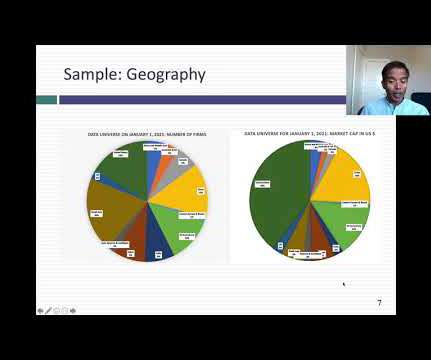
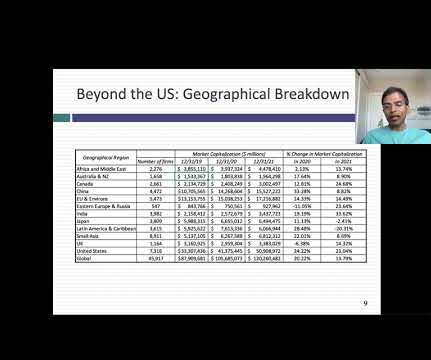
Not surprisingly, the company listings are across the world, and I look at the breakdown of companies, by number and market cap, by geography: As you can see, the market cap of US companies at the start of 2025 accounted for roughly 49% of the market cap of global stocks, up from 44% at the start of 2024 and 42% at the start of 2023.
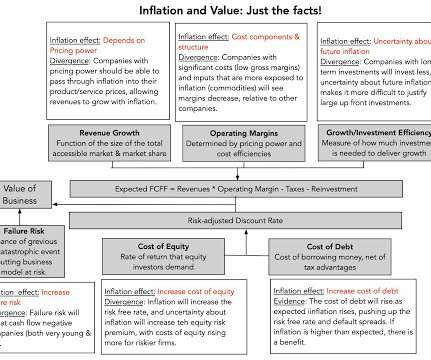
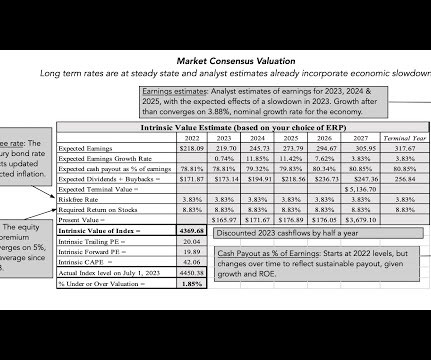
Following that rule book, I looked at the effects of inflation on the levers that determines value, in the graph below: Put simply, the effects of inflation on firm value boil down to the impact inflation has on expected cash flows/growth and risk.
This eleventh post in the Deja Vu series involving restricted stock studies addresses an issue that is rarely mentioned in the context of the studies – of the impact of dividends on restricted stock discounts (RSDs). Of these 244 transactions, only 24 involved companies that paid dividends, or less than 10% of the transactions.
This creates a unique opportunity for investors seeking stability and consistent returns, offering the potential for capital appreciation and attractive dividend yields. suggesting that the market may undervalue Cisco's future earnings potential. A closer look at Cisco's valuation reveals potential undervaluation.
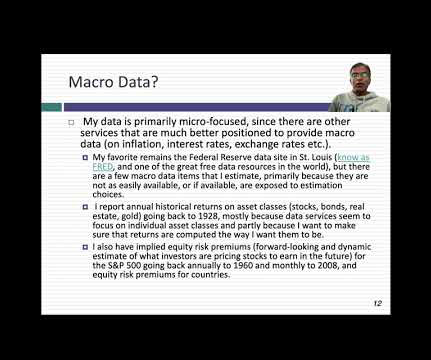
I have also developed a practice in the last decade of spending much of January exploring what the data tells us, and does not tell us, about the investing, financing and dividend choices that companies made during the most recent year. Dividends and Potential Dividends (FCFE) 1. Return on (invested) capital 2.
By analyzing factors like the price-to-earnings (P/E) ratio, price-to-book (P/B) ratio, and enterprise value-to-EBITDA (EV/EBITDA) ratio, companies can determine if their shares are undervalued or overvalued compared to peers. Dividend Discount Model DDM estimates the present value of expected future dividends from owning a stock.
To the extent that some of that risk capital is coming back into the markets, equity markets have benefited, with benefits skewing more towards the companies and markets that were punished the most in 2022. trillion) to marketcapitalizations, regaining almost half of the value lost in last year's rout.
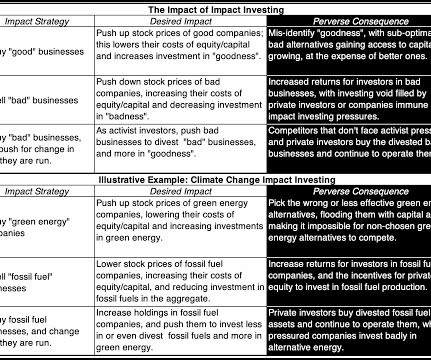
In the last two decades, this age-old investing behavior has come under the umbrella of impact investing, with several books on how to do it right, academic research on how it is working (or not), and organizations dedicated to advancing its mission.
The income-based approach determines a company’s value by assessing its anticipated future income-generating potential, employing methodologies such as Discounted Cash Flow (DCF) Analysis, Capitalization of Earnings, the Income Multiplier Method, Dividend Discount Model (DDM), and Earnings-Based Valuation.
How does negative equity affect dividends? Can a company still raise capital with negative equity? This pivotal metric is typically calculated by summing the marketcapitalization and net debt of the organization. Is negative equity value common in startups? What are some famous companies that had negative equity?
For example, I have seen it asserted that a stock that trades at less than book value is cheap or that a stock that trades at more than twenty times EBITDA is expensive. Data universe : In my sample, I include all publicly traded firms with marketcapitalizations that exceed zero, traded anywhere in the world. Price to Book 3.
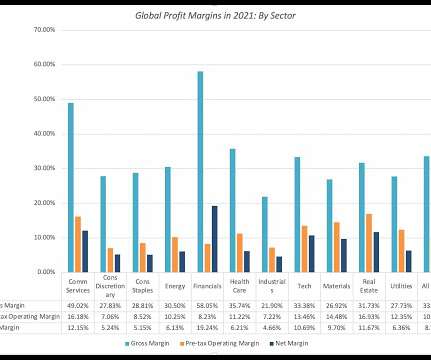
To make comparisons, profits are scaled to common metrics, with revenues and book value of investment being the most common scalar. The largest sector, in the US, in terms of marketcapitalization, is information technology and I have argued that tech companies age in "dog years" , with compressed life cycles.
This was primarily based on revenue growth, which registered a heady 30% rise, allowing the bank to distribute its highest full-year dividend since 2008. billion), which broke the bank’s all-time quarterly record in the final quarter of 2023, when it booked a hefty NT$5.8 Meanwhile, HSBC had a banner year in Hong Kong, raking in $24.6
In this post, I want to focus on that point, starting with a discussion of why stories matter to investors and traders and the story that propelled the company to a trillion-dollar marketcapitalization not that long ago. billion in revenues in 2021.
Do you have a shortage of working capital? Are you able to pay dividends or payments on lines of credit from suppliers? A decline in marketcapitalization is also a factor to consider when determining whether a triggering event for an impairment test has occurred. Are you in compliance with requirements?
Consider, for instance, an investor who picks stocks based upon price to book ratios, who finds a stock trading at a price to book ratio of 1.5. buy stocks that trade at less than book value or trade at PEG ratios less than one) for individual stocks.
Let’s refer to the book as Pratt’s Sixth Edition. Chapter 19 is titled “Discounts for Lack of Liquidity and Lack of Marketability.” 419) The Introduction of Chapter 19 contains the following paragraph: “These two concepts of lack of liquidity and lack of marketability are related but distinctly different. .”
Consequently, you can only value the equity in a bank, and by extension, the only pricing multiples you can use to price banks are equity multiples (PE, Price to Book etc.). The notion of computing a cost of capital for a bank is fanciful and fruitless, and any attempt to compute an enterprise value for a bank is destined to end in failure.
A few weeks ago, I posted on the corporate life cycle , the subject of my latest book. A Tech Star Stumbles: Intel’s Endgame In my book on corporate life cycles, I noted that even superstar companies age and lose their luster, and Intel could be a case study.
When you augment this price change with the dividends on the index during 2021, the total return on the S&P 500 for 2021 was 28.47%. The results are similar if you break stocks down based upon price to book ratios or revenue growth rates.
Given the historical roots of the biggest Indian family groups, the Adani Group has been a recent entrant, not making the top ten list (in terms of either operating metrics like revenues or market-based numbers like marketcapitalization or enterprise value) as recently as ten years ago, and barely making the top ten list five or six years ago.
For the market, it is often built on papers (or books) that look at the historical data on what equity markets have delivered as returns over long periods, relative to what you would have made investing elsewhere. The evidence for this strategy comes from many sources.
A second area of inquiry concerns dividend policy. The findings support the hypothesis that firms with loyalty shares tend to pay a smaller proportion of their earnings as dividends. The model, trained on multiple financial and structural variables, identifies Tobins Q , total assets , and share price as the strongest predictors.
It is not clear how marketcapitalization would be calculated in this contexte.g., whether it refers to an issuers consolidated group or only the issuing entity. The size toggle for determining federal versus state oversight is modeled off of similar concepts in the Lummis-Gillibrand bill and Hagerty discussion draft.
We organize all of the trending information in your field so you don't have to. Join 8,000+ users and stay up to date on the latest articles your peers are reading.
You know about us, now we want to get to know you!
Let's personalize your content
Let's get even more personalized
We recognize your account from another site in our network, please click 'Send Email' below to continue with verifying your account and setting a password.


Let's personalize your content