This site uses cookies to improve your experience. To help us insure we adhere to various privacy regulations, please select your country/region of residence. If you do not select a country, we will assume you are from the United States. Select your Cookie Settings or view our Privacy Policy and Terms of Use.
Cookie Settings
Cookies and similar technologies are used on this website for proper function of the website, for tracking performance analytics and for marketing purposes. We and some of our third-party providers may use cookie data for various purposes. Please review the cookie settings below and choose your preference.
Used for the proper function of the website
Used for monitoring website traffic and interactions
Cookie Settings
Cookies and similar technologies are used on this website for proper function of the website, for tracking performance analytics and for marketing purposes. We and some of our third-party providers may use cookie data for various purposes. Please review the cookie settings below and choose your preference.
Strictly Necessary: Used for the proper function of the website
Performance/Analytics: Used for monitoring website traffic and interactions
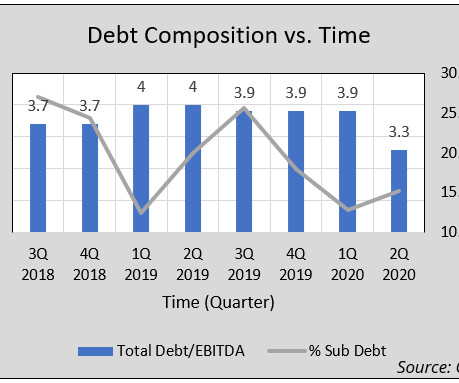
Debt Usage Decline In Q2 2020, total debt to EBITDA fell to 3.3x decline in total debt to EBITDA was attributed to a decline in senior debt to EBITDA, pushing the percentage of subordinate debt to total debt to 15.2%, up 2.4% Despite the simple average enterprise value (EV) to EBITDA multiple remaining at 7.4x
In Q2 2020, total debt to EBITDA fell to 3.3x decline in total debt to EBITDA was attributed to a decline in senior debt to EBITDA, pushing the percentage of subordinate debt to total debt to 15.2%, up 2.4% Despite the simple average enterprise value (EV) to EBITDA multiple remaining at 7.4x Debt Usage Decline.
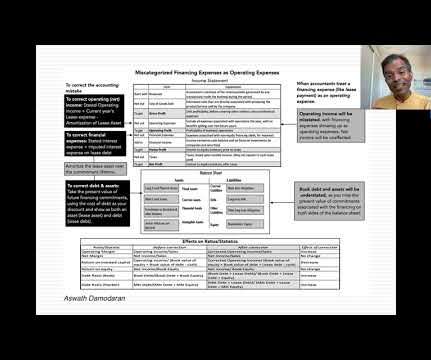
ATI was defined as EBITDA, that is, net taxable income after adding back interest expense, taxes, depreciation, and amortization. The CARES Act makes the deduction limitation less restrictive for 2019 and 2020 in three ways. Taxpayers may elect not to apply the 50% limitation to either 2019 or 2020, if they choose. Bottom line.
has seen a significant increase since the debut of the Netflix series “Drive to Survive” in 2019. billion of annual revenue and $560 million of EBITDA. By comparison, U.S. viewership averaged just over 1 million. F1 interest in the U.S. Average U.S. million in 2022. Formula One Group, founded in 1950, was purchased for $4.4
Feb 2023 data ] Industry EBITDA multiples, sourced from analysis by Prof. The theme is a return to roughly where we were in summer 2019. Aswath Damodaran of NYU Stern university. [ Feb 2023 data ] Below we share our analysis of these updates in more detail. Airlines, which we discussed in our 5.4 in February 2020, to 24.89
Median EBITDA Margin Is Negative but Cash Flow Looks Promising Median EBITDA margin was -4%, but more than half (56%) of the companies with negative EBITDA had positive cash flow. Only 27 of the 62 companies with negative EBITDA margin also had negative cash flow. Only 4 SaaS companies traded higher than 20X in Q4.
EBITDA multiple 1 on 2019EBITDA. The EBITDA multiple includes approximately $136 million of estimated foregone capital expenditures over the next five years. The blended EBITDA multiple on our seven hotel acquisitions is 13.0x Since the beginning of 2021, we have invested $1.6
Recent M&A deals KHC has been making headlines with strategic moves like acquiring Cerebos Pacific in 2018 and selling off assets such as its Indian nutritional beverage and Canadian natural cheese businesses in 2019. Adjusted EBITDA decreased 5.8% billion in 2020. Net income increased 131.3% billion using a WACC of 6.3%.
Recent M&A deals KHC has been making headlines with strategic moves like acquiring Cerebos Pacific in 2018 and selling off assets such as its Indian nutritional beverage and Canadian natural cheese businesses in 2019. Adjusted EBITDA decreased 5.8% billion in 2020. Net income increased 131.3% billion using a WACC of 6.3%.
A useful tip is to check for consistency between the forecast margins and historical margins—EBITDA margin, EBIT margin, and Net Income margin. Hockey stick-like growth in your DCF projections may indicate these projections are not realistic.
Plaintiff did not dispute the factual accuracy of any information actually contained within the proxy statement regarding revenue and EBITDA projections for 2017 and 2018 and their underlying assumptions. Morgan Securities LLC conducted before concluding that the deal was fair. First, the Court held that that they were “pure omission claims.”
times Grand Prix's estimated 2023 adjusted EBITDA multiple and allows Targa to further benefit by now owning 100 percent of the recently announced Daytona Pipeline expansion of Grand Prix. Given our expected record 2022 EBITDA and. The acquisition price represents approximately 8.75 Full story available on Benzinga.com.
Its financial profile now looks like this: Its Debt / EBITDA is now 10x, its EBITDA / Interest has fallen below 1x, the Secured Debt is trading at 90% of its face value, and the Unsecured Debt is down to 60%. A few years later, the company’s industry declined, and it was slow to cut costs and enter new markets.
Orinter is a disruptive growth company in a high growth market, evidenced by its 2019 – 2022 net revenue CAGR of 38%, despite two full years of the pandemic. The acquisition, valued at approximately $40 million is comprised of cash and Mondee (MOND) common stock, plus an additional future earn-out linked to increases in EBITDA.
In the chart below, I look at the pricing of fossil fuel companies over time, using EV to sales and EV to EBITDA as pricing metrics: While the pricing metrics swing from year to year, that has always been true at oil companies, since earnings and revenues vary, with oil prices. in the 1998-2010 time period to 5.95
Even assuming a top line growth rate superior to that of Match.com for the next 5 years, averaging over 20% (compared to 35% in 2019 and 19% in 2020, admittedly in adverse conditions due to the Covid lockdowns) the DCF for Bumble doesn’t make the case for much optimism. Our findings suggest a valuation of $4.6Bn may be more adequate.
EBITDA multiple on 2019 results and a $455K per key valuation –. – Net Proceeds are expected to be used for general corporate purposes including, but not limited to, additional debt repayment and dividend payments –. Price implies a blended 2.9% cap rate and 27.0x PHILADELPHIA, Sept.
EBITDA multiple on 2019 results and a ~ $455K per key valuation–. – Price implies a blended 2.9% cap rate and 27.0x Coupled with the USS-7 sale and pending dispositions, the sale of Hotel Milo and Pan Pacific would increase total sales to nearly $650M in 2022–.
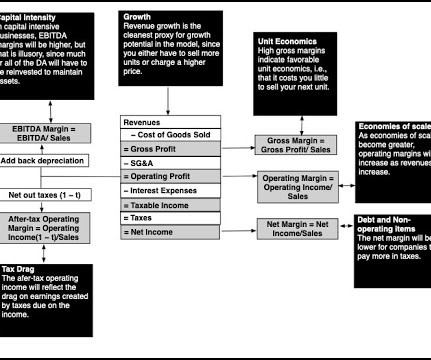
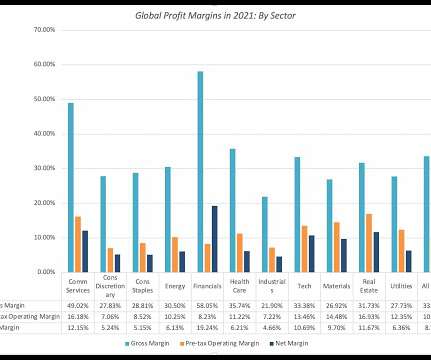
Across the globe, close to 84% of firms had positive gross profits, but that drops to 67% with EBITDA, 62% percent with operating income and 61% with net income. The EBITDA margin is an intermediate stop, and it serves two purposes.
billion sales and 25% adjusted EBITDA margin – which excludes Marucci Acquisition continues FOX's track record of generating successful returns from M&A outside of legacy core shock and suspension business DULUTH, Ga., 15, 2023 (GLOBE NEWSWIRE) -- Fox Factory Holding Corp.
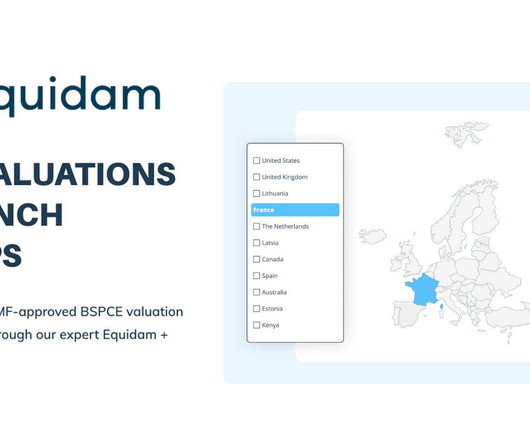
Industry EBITDA multiples used in the VC and DCF with multiple methods Our multiples are based on public market conditions at the beginning of the current year. You can refer to the table at this link to see how they will change for your country specifically. Data is taken at the global level and aggregated by industry.
However, PMI rebounded in 2019, seeing a 29.7% billion to USD 108 billion by applying the observed trading multiples EV/Sales, EV/EBITDA, EV/EBIT and P/E. rise by February. The stock reached its all-time high of USD 104.66 in February 2022 and closed at USD 91.78 on June 08, 2023. Scandinavian Tobacco Group A/S and Vector Group Ltd.
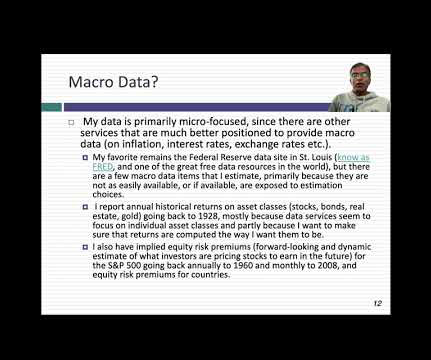
Historical Data: 1930-2019 To see how this framework works in practice, let's start by looking at the performance of US stocks, across the decades, and look at the returns on stocks, broadly categorized based on market capitalization and price to book ratios.
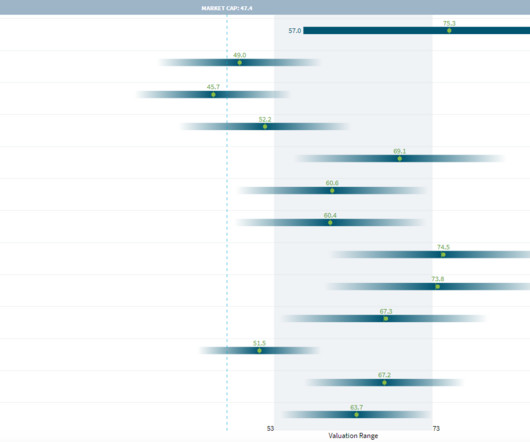
In 2019, the company announced that it plans to reduce its oil and gas output by 40% by 2030. The Trading Comparables analysis resulted in a valuation range of GBP 98 (USD 199) billion to GBP 137 (USD 166) billion by applying the observed trading multiples EV/EBITDA, EV/EBIT, P/E and P/B. billion worth of shares.
Despite the staggering profits, TotalEnergies has had to deal with a report published by Greenpeace, where the company was accused of having three to four times higher CO 2 emissions than they have stated for 2019. This could threaten the progress being made toward their net zero emission goal.
Despite the staggering profits, TotalEnergies has had to deal with a report published by Greenpeace, where the company was accused of having three to four times higher CO 2 emissions than they have stated for 2019. This could threaten the progress being made toward their net zero emission goal.
Thus, I have treated leases as debt in computing debt ratios all through the decades that I have been computing this statistic, even though accounting rules did not do so until 2019, and capitalized R&D, even though accounting has not made that judgment yet. EBIT & EBITDA multiple s 5.
We delve into a large sample of executive performance equity grants made to 6,947 executives in 841 S&P 1500 firms with available vesting details and executive compensation data between 2006 and 2019. The number of granting firms, performance equity grants, and executives receiving a grant increase almost steadily over sample years.
As reflected in its results to date, zTrip's business model has enabled the achievement of both solid financial results and growth while maintaining EBITDA profitability, which is based to a considerable extent on zTrip's continuing revenue base and consistent operational efficiencies. transportation industry.
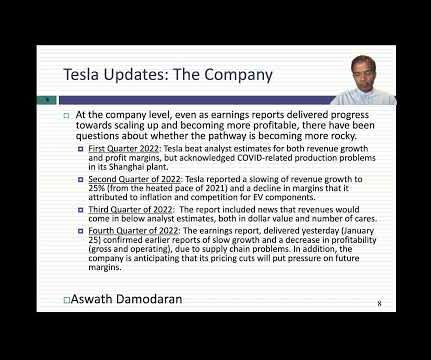
Tesla's rise is summarized in the graph below, where we look at the company's revenues and earnings over time, with earnings measured in gross and operating terms, and EBITDA capturing operating cash flows: 2022 numbers updated to reflect 4th quarter earnings call on 1/25/23 Between 2010 and 2020, Tesla grew revenues from $117 million to $31.5
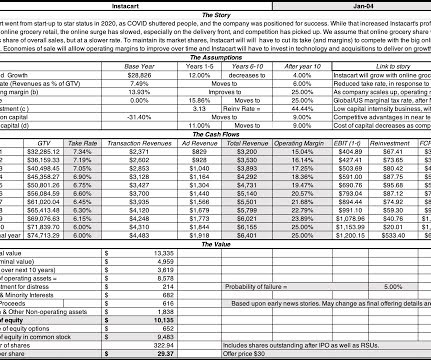
Instacart's take rate has improved over time, doubling from 2.86% in 2019 to 5.70% in 2020, before leveling off in 2021 and 2022, and then increasing again to 7.49% in the last twelve months of 2023.
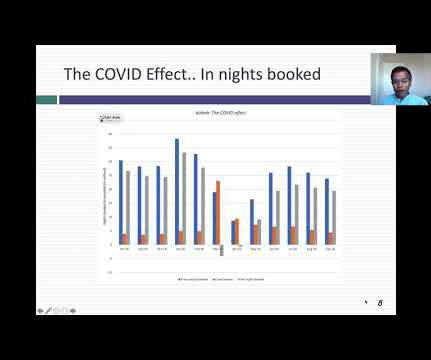
In the graph to the right, you can see the effects on the financials, in a comparison of first nine months of 2019 to the first nine months of 2020, with gross bookings dropping 39% and operating losses almost tripling over the period. The Market (TAM) There are two ways in which I can describe Airbnb's total addressable market.
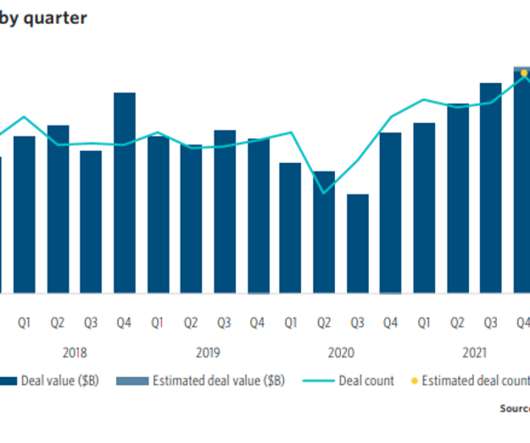
Average EBITDA multiples have consequently dropped in comparison to last year’s frenzied M&A period. As illustrated in the chart below, Q3 estimated deal value is consistent with 2017 to 2019 averages, and deal count came in higher than the average for the same period.
Ian Gallienne, CEO of Groupe Bruxelles Lambert ("GBL"), the majority stakeholder in Webhelp since 2019, said, "Following the remarkable development of Webhelp since our investment in 2019, GBL is looking forward to being part of the continued success and growth story that lies ahead. Webhelp is expected to generate approximately $3.0
Employee manuals and personnel policies Benefit plans Retirement plans, pension plans and funding condition For an even longer list, see a 2019 Forbes article, “ A Comprehensive Guide To Due Diligence Issues In Mergers And Acquisitions.” “One Will key employees stay? Are there employment agreements?
The total value of closed e-commerce deals in 2021 was nearly double that of 2020, and 2020’s total value was 8x 2019’s total value. multiple of SDE or EBITDA. Founded in 2019, Verma Farms takes a unique and playful approach to CBD with its ever-growing inventory of CBD gummies, oils, dried fruit, and topical products.
Combined Company targeting a low teen Adjusted EBITDA CAGR through 2023 from a 2021 base of $305 million 1. billion of Revenue and $305 million of Adjusted EBITDA in 2021 4. Combined Company Adjusted EBITDA. ($ in millions). Pro forma for the merger, Leonardo SpA and RADA shareholders will own approximately 80.5% 2,764. . .
In 2021, companies recovered entirely from the damage done in 2021, at least in the aggregate, with earnings in 2021 higher than 2019 earnings, by almost 33%.
Beneficiaries of BSPCEs are typically employees and executive managers of the company (and since 2019, also employees of its subsidiaries), as well as certain board members – essentially the people actively involved in building the company.
So, if my valuation date is December 31, 2019 and my report date is June 30, 2020, the only things I am supposed to consider in the six month period following the valuation date are things that were known or “knowable” as of the valuation date. SDE is essentially EBITDA plus all the ways one owner makes money including salary and benefits.
Until accountants came to their senses in 2019 , they routinely treated a large segment of leases as debt, with questionable reasons, and skewed operating margins, returns on capital and debt ratios in lease-heavy sectors like retailing and restaurants. billion, which results in an adjusted PE ratio of about 6.
Venture capitalist, raised on a diet of big stories and total addressable markets has little in common with bankers, trained to think in terms of EV to EBITDA multiples and accounting ROIC, and when put in a room together, it should come as no surprise that they find each other's language indecipherable.
15] maximum level of debt relative to equity or cash flow (some of the most commonly used metrics are the debt-to-EBITDA ratio and loan-to-value ratio). [16] 30] Bloomberg Television, Why Unitranche Deals Are So Popular , YouTube (Nov 27, 2019), [link]. [31] See Commercial & Industrial Lending , FDIC Bank Resource Center, [link].
Share Price Performance The counter had a very good start to 2019 with a new all time high of $440 per share. The Trading Comparables analysis resulted in a valuation range of $121 billion to $150 billion by applying the observed trading multiples EV/EBITDA and EV/EBIT. The DCF analysis produced a value of $93.5
We organize all of the trending information in your field so you don't have to. Join 8,000+ users and stay up to date on the latest articles your peers are reading.
You know about us, now we want to get to know you!
Let's personalize your content
Let's get even more personalized
We recognize your account from another site in our network, please click 'Send Email' below to continue with verifying your account and setting a password.


Let's personalize your content