article thumbnail

Middle Market Private Equity M&A Activity – Q2 2020

Value Scope

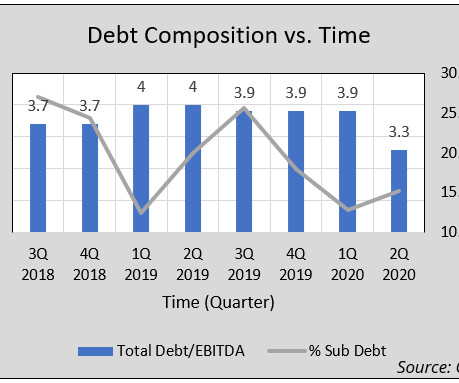
Click to Download: Middle Market Private Equity M&A Activity – Q2 2020 Executive Summary Transaction Volume Shrinks Only 31 transactions were reported in Q2 2020, bringing the total reported transactions in 2020 to 113. Debt Usage Decline In Q2 2020, total debt to EBITDA fell to 3.3x the prior quarter. in 2020 from 8.4x

Equity 130
article thumbnail

Middle Market Private Equity M&A Activity – Q2 2020

Value Scope

Click to Download: Middle Market Private Equity M&A Activity – Q2 2020. In Q2 2020, total debt to EBITDA fell to 3.3x decline in total debt to EBITDA was attributed to a decline in senior debt to EBITDA, pushing the percentage of subordinate debt to total debt to 15.2%, up 2.4% Executive Summary. Size Premium.

Equity 130
Insiders

Sign Up for our Newsletter

This site is protected by reCAPTCHA and the Google Privacy Policy and Terms of Service apply.

Trending Sources

article thumbnail

Data Update 1 for 2025: The Draw (and Danger) of Data

Musings on Markets

If you want to check out which industry group a company falls into, please click on this file (a very large one that may take a while to download) for that detail. EBIT & EBITDA multiple s 5. The industry averages that I report are also provided using the regional breakdown above. Standard Deviation in Equity/Firm Value 2.

article thumbnail

Axial Releases the Top 25 Lower Middle Market Investment Banks for Q1 2022

Benzinga

Download the Q1 2022 Lower Middle Market Investment Banking League Tables. "The and an average EBITDA of $3.1M. "This is just the latest data point to demonstrate that deal activity in the lower middle market isn't correlated with public markets or large cap M&A.

Banking 52
article thumbnail

Data Update 1 for 2024: The data speaks, but what does it say?

Musings on Markets

EBIT & EBITDA multiple s 5. Working capital needs Thus, I compute pricing multiples based on revenues (EV to Sales, Price to Sales), earnings (PE, PEG), book value (PBV, EV to Invested Capital) or cash flow proxies (EV to EBITDA). Long term Reinvestment (Cap Ex & Acquisitons) 4. Be patient.

Dividends 106
article thumbnail

The role of financial projections in startup valuation

Equidam

Show me how you see that journey playing out in terms of revenue, costs, cash flow and EBITDA. If you’re going to ask me to believe a story about your team, your product, and your market, then it’s useful to see how it looks in a model.

article thumbnail

How to Value Pre-Revenue Startups

Equidam

This potential is typically evaluated through assumptions about future growth trajectories, often modeled via projected revenue growth or, in more mature markets, EBITDA projections. Examples include: User Engagement: Metrics like user sign-ups, active usage rates (MAU/DAU), waitlist size, or downloads.