
Will the IPO of ABB’s E-Mobility division give the share price a new boost?
Valutico
NOVEMBER 28, 2022
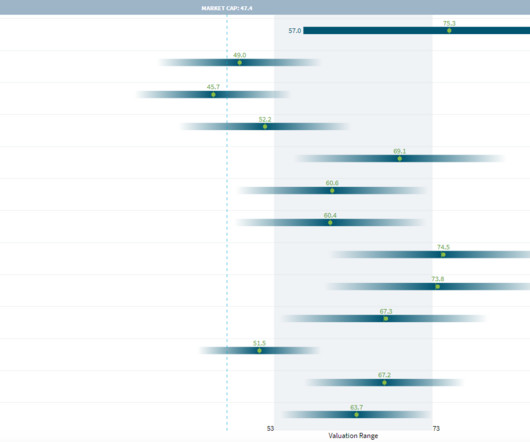
billion with EBIT margin increasing to 16.6% ABB’s five-year share price chart is shown below: Source: Yahoo Finance, [link]. We analyzed ABB by using the Discounted Cash Flow method, specifically our Flow to Equity approach, as well as a Trading Comparables analysis. Sales rose 5% to CHF 7.1 from 15.1%


Let's personalize your content