Remove Beta Remove EBITDA Remove Risk Premium
article thumbnail

Data Update 1 for 2025: The Draw (and Danger) of Data

Musings on Markets

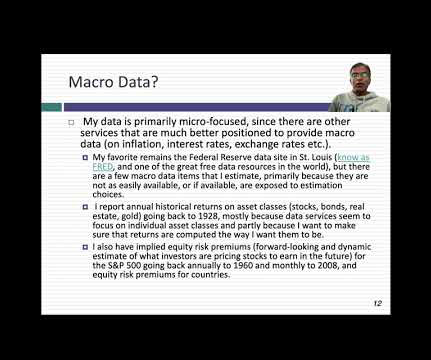
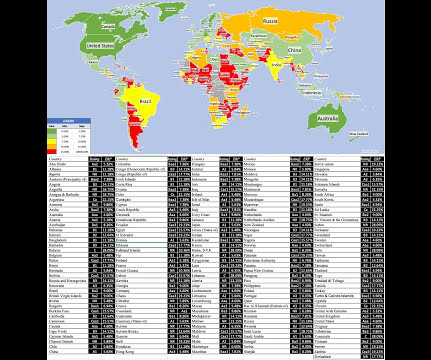
Thus, as you peruse my historical data on implied equity risk premiums or PE ratios for the S&P 500 over time, you may be tempted to compute averages and use them in your investment strategies, or use my industry averages for debt ratios and pricing multiples as the target for every company in the peer group, but you should hold back.

article thumbnail

9 Startup Valuation Methods: 5 to Use, 4 to Avoid

Equidam

revenue multiple, ARR multiple, EBITDA multiple) derived from recent acquisitions or funding rounds of supposedly similar companies. This incorporates the risk-free rate, a market risk premium specific to the company’s country, and Beta ($beta$).

Insiders

Sign Up for our Newsletter

This site is protected by reCAPTCHA and the Google Privacy Policy and Terms of Service apply.

Trending Sources

article thumbnail

Data Update 1 for 2024: The data speaks, but what does it say?

Musings on Markets

Beta & Risk 1. Equity Risk Premiums 2. EBIT & EBITDA multiple s 5. Working capital needs Thus, I compute pricing multiples based on revenues (EV to Sales, Price to Sales), earnings (PE, PEG), book value (PBV, EV to Invested Capital) or cash flow proxies (EV to EBITDA). Return on Equity 1. Buybacks 2.

Dividends 106
article thumbnail

Data Update 1 for 2023: Setting the table!

Musings on Markets

By the same token, it is impossible to use a pricing metric (PE or EV to EBITDA), without a sense of the cross sectional distribution of that metric at the time. For example, I have seen it asserted that a stock that trades at less than book value is cheap or that a stock that trades at more than twenty times EBITDA is expensive.

article thumbnail

Data Update 5 for 2024: Profitability - The End Game for Business?

Musings on Markets

In my last three posts, I looked at the macro (equity risk premiums, default spreads, risk free rates) and micro (company risk measures) that feed into the expected returns we demand on investments, and argued that these expected returns become hurdle rates for businesses, in the form of costs of equity and capital.

Equity 82
article thumbnail

The Dividend Discount Model (DDM): The Black Sheep of Valuation?

Brian DeChesare

In our forecast, Cash rises too much, and Debt / EBITDA goes from 5.0x Dividend Discount Model, Part 4: Present Value of Terminal Value and Dividends Since the Dividend Discount Model is based on Equity Value, not Enterprise Value, the Discount Rate is the Cost of Equity: Risk-Free Rate + Equity Risk Premium * Levered Beta.

article thumbnail

Discounted-Cash-Flow-Analysis: Your Complete Guide with Examples

Valutico

Practitioners assume the business is sold as a multiple of some financial metric like EBITDA, based on what they can see today for other businesses that were sold, and what these comparable trading multiples are. . Rf = Risk-free Rate. B = Beta. (Rm Rm – Rf) = Equity Market Risk Premium. EV/EBITDA Multiple.