Remove 2024 Remove Beta Remove EBIT
article thumbnail

Data Update 1 for 2025: The Draw (and Danger) of Data

Musings on Markets

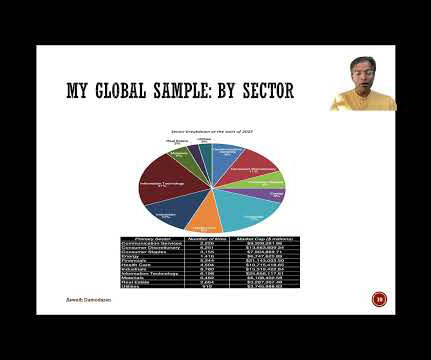
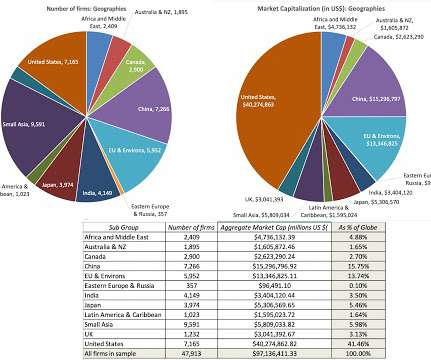
Not surprisingly, the company listings are across the world, and I look at the breakdown of companies, by number and market cap, by geography: As you can see, the market cap of US companies at the start of 2025 accounted for roughly 49% of the market cap of global stocks, up from 44% at the start of 2024 and 42% at the start of 2023.

article thumbnail

Data Update 1 for 2024: The data speaks, but what does it say?

Musings on Markets

Beta & Risk 1. EBIT & EBITDA multiple s 5. Thus, when computing my accounting return on equity in January 2024, I will be dividing the earnings from the four quarters ending in September 2023 (trailing twelve month) by the book value of equity at the end of September 2022. Return on Equity 1. Debt Details 1. Buybacks 2.

Dividends 106
article thumbnail

Data Update 1 for 2023: Setting the table!

Musings on Markets

I also report on pricing statistics, again broken down by industry grouping, with equity (PE, Price to Book, Price to Sales) and enterprise value (EV/EBIT, EV/EBITDA, EV/Sales, EV/Invested Capital) multiples. EV/EBIT and EV/EBITDA 4. EBITDA, EBIT and EBITDAR&D Margins 3. Cost of Equity 1. PE & PEG 2. Cost of Debt 2.