March 2024 SAAR


The March 2024 SAAR was 15.5 million units, a 1.3% decrease from last month and a 3.7% increase compared to this time last year. The year-over-year sales improvement, along with declining transaction prices and generally flat inventory levels, may indicate that the industry is reverting to pre-pandemic trends.
Unadjusted Sales Data
On an unadjusted basis, the industry sold 1.44 million total units in March 2024, a 16.1% increase from February 2024 volumes. This may seem like a significant jump, but the February-to-March sales increase has typically been well over 20%. While March 2024 sales are not quite back to pre-pandemic levels, there continues to be upward momentum in March sales volumes. The chart below shows unadjusted total sales volumes for the last eight Marches:

Inventory and Days’ Supply
An inventory-to-sales ratio greater than 1.0x indicates that the seasonally adjusted inventory level at the end of the month was greater than reported sales. In February 2024, the inventory-to-sales ratio decreased to 1.34x from 1.39x in January 2024. Additionally, February 2024 marks the sixth consecutive month above 1.0x, which may indicate that the industry inventory has generally recovered from the impact of the pandemic. The chart below illustrates the industry’s inventory-to-sales ratio over the last three years.

Days’ Supply, another indication of the relationship between auto sales and inventory, has remained generally elevated over the last year. Even though March 2024 Days’ Supply dipped to 49, it is likely that Days’ Supply will hover in the high 40s to low 50s over the next few months as the industry returns to pre-pandemic cyclicality. The chart below presents Days’ Supply for U.S. Light Vehicles over the past twelve months (per Wards Intelligence):
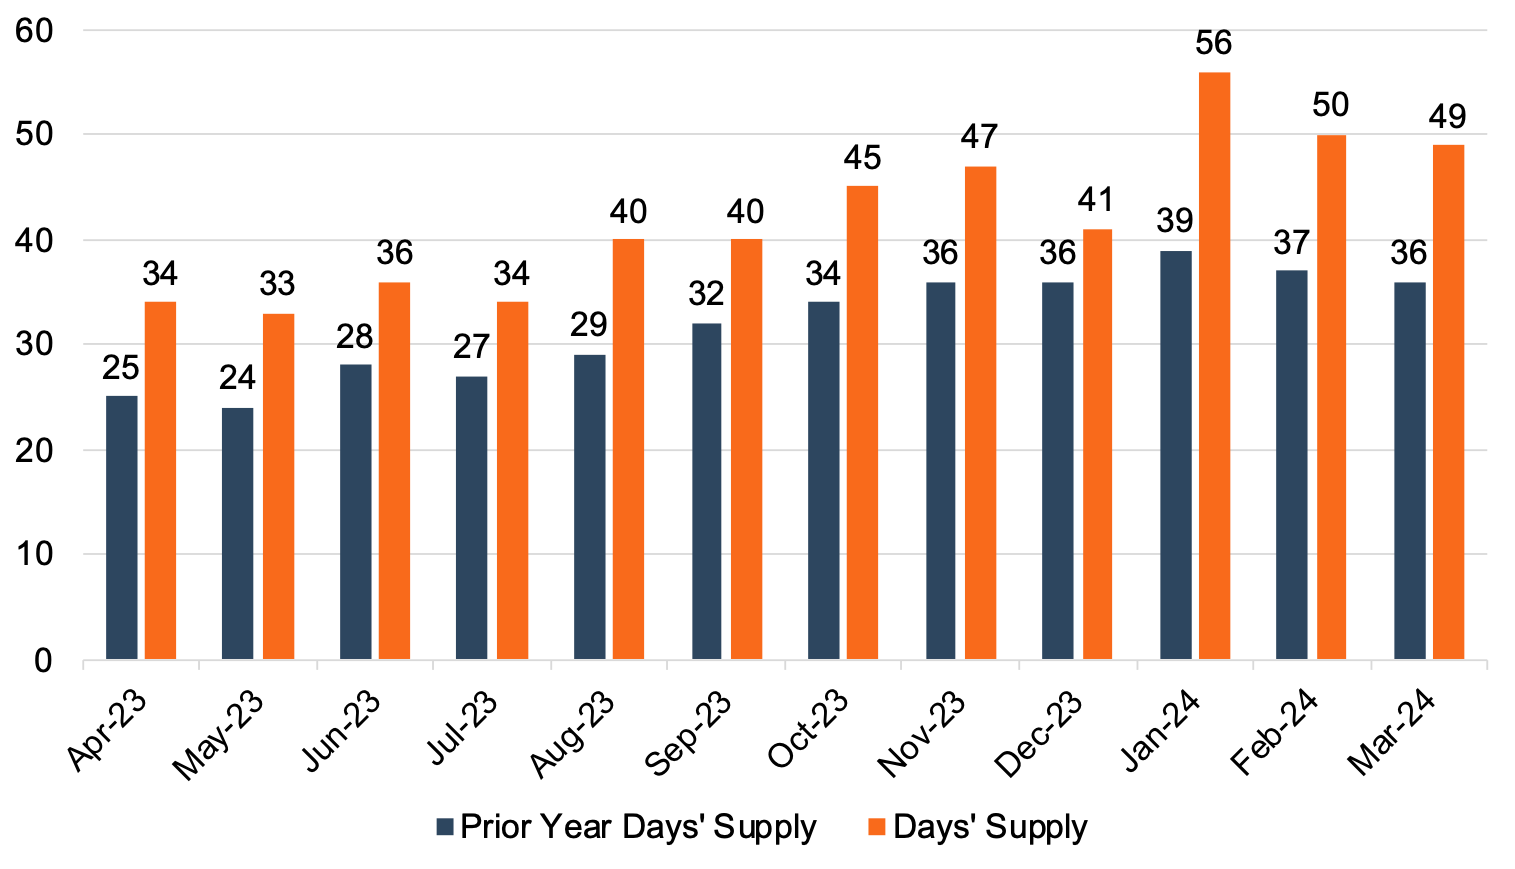
While inventory levels continue to show signs of recovery from the pandemic, we expect to see additional pressures on inventory levels as a result of the tragic Baltimore Bridge collapse in the next several months.
Transaction Prices
Thomas King, president of data and analytics at J.D. Power, discussed the downward trend in average transaction prices for new vehicles in March:
“New-vehicle sales for the first quarter are projected to increase 4.5% from Q1 2023 when adjusted for selling days. In conjunction with robust sales for Q1, elevated transaction prices mean that consumers are expected to spend more than $129 billion buying new vehicles, an all-time Q1 record. However, while the sales and expenditure performance are impressive, it is coming at the expense of reduced retailer and manufacturer profitability as inventories of unsold vehicles rise and competitive pressures intensify.”
“The average new-vehicle retail transaction price is declining as manufacturer incentives rise, retailer profit margins fall and availability of lower-priced vehicles increases. Transaction prices are trending towards $44,186—down $1,648 or 3.6%—from March 2023, the largest decline in March ever. However, despite that, higher sales volumes mean consumers are on track to spend nearly $51 billion on new vehicles this month—the highest ever for the month of March and 6.5% higher than March 2023.”
According to J.D. Power, the March average used-vehicle price of $27,950 is down 4.3% from last year. Falling transaction prices are also impacting trade-in values, which are down about 12% from last year. As inventory levels continue to recover, we will likely see the average transaction price moderate throughout 2024. Continued inventory expansion, increasing incentives, and heightened consumer competition will likely put pressure on per-unit dealer profit and transaction prices in the remainder of 2024.
Incentive Spending
J.D. Power notes that average incentive spending per unit in March is expected to hit $2,800, up over 66% from one year ago. Incentive spending as a percentage of the average MSRP is expected to reach 5.8% in March 2024, reflecting an increase of 2.2 percentage points from March 2023. While incentive spending remains elevated in March, keep in mind these are average figures, and some markets and vehicle make/models are still transacting above MSRP, as noted by Mr. King.
April 2024 Outlook
Mercer Capital expects the April 2024 SAAR to come in around the 15 million mark. As inventory levels trend higher in the coming months, OEMs and retailers will face more competition for sales. We anticipate the heightened competition and additional options for buyers will push incentives up and the average transaction price down. For brand-agnostic consumers, we expect there to be deals available.
Mercer Capital provides business valuation and financial advisory services, and our auto team helps dealers, their partners, and family members understand the value of their business. Contact a member of the Mercer Capital auto dealer team today to learn more about the value of your dealership.