 Print
PrintLinda Pappas is Principal, and Jose Lawani and Perla Cuevas are Consultants at Pay Governance LLC. This post is based on their Pay Governance memorandum.
The 2023 Say on Pay (SOP) season has a unique hallmark unlike previous SOP years: most companies within the S&P 500 have experienced significant decreases in total shareholder return (TSR) in the most recent performance year (2022) for the first time since SOP was mandated in 2011. These decreases have resulted in the S&P 500 index experiencing a -19% decline for 2022.
Pay Governance has compiled a significant amount of information on SOP outcomes and related TSRs for the S&P 500 since the dawn of the SOP era. We have analyzed these data to develop a framework for potential outcomes for the 2023 SOP season.
This post presents a historical view on the relationship between S&P 500 SOP pass and fail rates and related TSR performance during the SOP era and, using history to forecast the future, provides an early potential 2023 SOP season forecast within in the context of negative shareholder returns experienced in 2022 by most of the S&P 500.
This post serves as a starting point for evaluating the 2023 SOP season and will be accompanied by a more detailed Viewpoint in the coming months when further 2023 SOP outcomes are available and more additional conclusions can be reached regarding the 2023 SOP season.
Background: Say on Pay 2011 – 2022
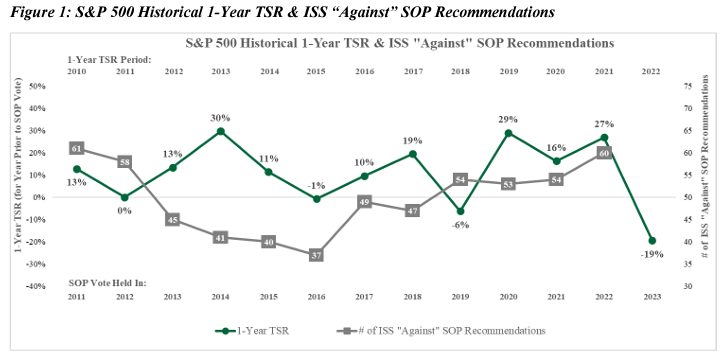
The SOP era has been characterized by generally positive TSR throughout the period. Figure 1 below shows:
- Historical 1-year TSR [1] for the S&P 500 index has been positive in virtually every year, with the following exceptions:
- 2011 and 2015, when S&P 500 index TSR was close to zero (0% and -1%, respectively).
- 2018, when index TSR was -6%.
- 2022, when, for the first time, S&P 500 index TSR declined by double digits, coming in at -19%.
- The number of S&P 500 companies receiving an “Against” vote recommendation from ISS has increased in recent years [2] :
- Historical “Against” vote recommendations by year have varied between 37 and 61 companies, and on average, about 10% of the S&P 500 (50 companies) received an “Against” recommendation from ISS. More recently, over the past 6 years, ISS “Against” SOP recommendations have varied between 47 and 60 companies.
- We have not included year-to-date “Against” recommendations for 2023, as we are at the very beginning of the 2023 SOP season. We will cover 2023 SOP outcomes in our companion Viewpoint later this year.
However, when we consider the number of S&P 500 companies in each year that failed the actual SOP vote (i.e., receiving less than 50% shareholder support), a different picture emerges, as shown in Figure 2 below. (Note: the years referenced in Figure 2 are when the SOP vote took place.)

We observe the following:
- At the outset of SOP, S&P 500 failure rates began at 1.8% in 2011 and increased to 3.0% in 2012.
- The number of failed SOP votes among the S&P 500 was generally flat from 2013 – 2019, varying between 4 and 7 each year: an annual failure rate of about 1.0% – 1.5%.
- The number of failed SOP votes began increasing in 2020 and peaked in 2022 at 22 failed votes among the S&P 500 companies: a failure rate of 4.6%.
- While the number of companies receiving an ISS “Against” recommendation in 2011 is almost the same as those receiving an “Against” recommendation in 2022 (61 and 60 respectively), the number of actual SOP failures has almost tripled from 8 to 22.
Further, when we consider the key outcomes shown in Figures 1 and 2 together, the increased SOP failure rate among the S&P 500 occurred when annual TSR levels were among the highest recorded in the SOP era: 29%, 16%, and 27% for 2019, 2020, and 2021, respectively. Reasons for the increase in failures in recent years likely include:
- Greater scrutiny of pay practices by proxy advisors and institutional investors as we move deeper into the SOP era.
- Heightened attention over the past several years to the quantum of pay provided versus prior years without regard to absolute or relative performance.
We anticipate such scrutiny will not abate in the 2023 SOP season.
The Upcoming 2023 Say on Pay Season
When we consider the significant increase in failed SOP votes over the past 3 years within the context of higher TSR performance in 2019 – 2021, we predict an increase in S&P 500 SOP failures in 2023 compared to recent historical outcomes due to poor S&P 500 2022 shareholder returns (-19% at the median of the S&P 500 index as referenced in Figure 1). Using recent history to inform our expectations of the 2023 SOP season, the S&P 500 could possibly experience the highest failure rate since 2011.
However, before we conclude that an increase in failure rates is on the horizon for the 2023 season, the following considerations should also be weighed:
- A longer-term look at S&P 500 TSR
- The use by proxy advisors and institutional investors of relative TSR in determining SOP votes
- A healthy increase in S&P 500 TSR in the first quarter of 2023
- The implementation of the new Pay vs. Performance (PVP) disclosures for the first time in the 2023 proxy statements
Proxy advisors and institutional investors commonly compare the most recent 3-year TSR and 3-year pay as one of the key criteria when determining how to recommend or vote on SOP. Ahead of the 2023 SOP votes, we determined the most recent 3-year TSR for the calendar years 2020 – 2022, which are shown in Figure 3 below along with similar historical outcomes:

Figure 3 shows that, despite the SOP era record low annual TSR for 2022, the 3-year annualized TSR is positive at 6%, reflecting the positive TSR of 2021 and 2020. However, the 3-year TSR outcome for 2020 – 2022 is the second lowest of the SOP era, with the lowest being the inaugural SOP period ending in 2010.
Further, proxy advisors and institutional investors also compare TSR on a relative basis to peer groups for each of the S&P 500 companies. Given the general overall decline in TSR in 2022, it is likely the peer group TSR is down as well, meaning that lower performance by any individual company probably was directionally matched by the peer group associated with the company. Such directional alignment may reduce the number of potential SOP failures.
During the first quarter of 2023, TSR of the S&P 500 index increased by about 7%: not enough to offset the shareholder losses incurred during 2022, but perhaps enough to make investors feel more positive about future returns when voting on 2023 SOP ballots in the April – May timeframe. This is an entirely subjective issue that is not considered in the evaluations performed by the proxy advisors and institutional investors but can be a positive factor in potential voting outcomes, just as negative returns in the same timeframe would be viewed negatively.
A wildcard in the evaluation of SOP by the proxy advisors and institutional investors is the PVP disclosures appearing for the first time in the 2023 proxy statements. While proxy advisors have stated the PVP disclosures will not be used in the SOP evaluations this year, our preliminary examination of the outcomes of PVP disclosures among 160 early-filing S&P 500 companies shows a high directional alignment between “Compensation Actually Paid” and TSR performance. [3]
We speculate that companies who expect a challenging SOP vote could use the PVP disclosures in their defense, particularly if the PVP disclosures show a tighter relationship between pay and TSR performance. However, we note most companies who expect to pass the SOP vote have not emphasized the PVP disclosures, viewing them in this inaugural year as a difficult, but necessary, process to complete that may not have significant relevance in the near term.
This is also a year in which executive pay and performance outcomes will reveal, on a large scale, an issue well understood by Compensation Committees and their members. Specifically, TSR performance can change much more rapidly than pay can adjust. In a 3-year comparison of pay and performance, as used by the proxy advisors and some institutional investors and which is based on the SCT table, 3-year pay is fixed and cannot be changed for most of the period, while TSR can and does change on a continuous basis until the very end of the 3-year period.
By the end of a year in which share prices declined significantly, as occurred during calendar year 2022, little can be done to impact 3-year pay as reported in the SCT. This outcome is driven by the static nature of equity valuation in an SCT-based calculation, while 3-year TSR outcomes are much more dynamic and volatile in nature. The PVP disclosures attempt to address this imbalance by showing changes in equity values since grant. Other methods have been used prior to the newly defined PVP pay calculations to try to achieve the same results, such as realizable/realized pay calculations.
Conclusion
While the significant decline in S&P 500 index TSR in 2022 seems to signal a meaningful increase in negative SOP outcomes in 2023, we think there are mitigating factors that could dampen the overall impact. Our expectations are that SOP failures may continue at the elevated rate of the past 3 years but may not surge higher. We will provide an updated assessment of the 2023 SOP season once it is substantially concluded in the coming months.
Endnotes
1TSR data for the S&P 500 were collected from S&P’s Capital IQ database.(go back)
2ISS vote recommendations and SOP vote outcomes were collected from ISS Corporate Solutions Voting Analytics database.(go back)
3Ira Kay, Mike Kesner, Linda Pappas, and Ed Sim. What Shareholders Can Learn from the SEC’s New Pay Versus Performance Disclosure. Pay Governance. April 19, 2023.(go back)