 Print
PrintMike Kesner and Tara Tays are Partners, and Jonah Saraceno is a Consultant at Pay Governance LLC. This post is based on their Pay Governance memorandum.
Introduction
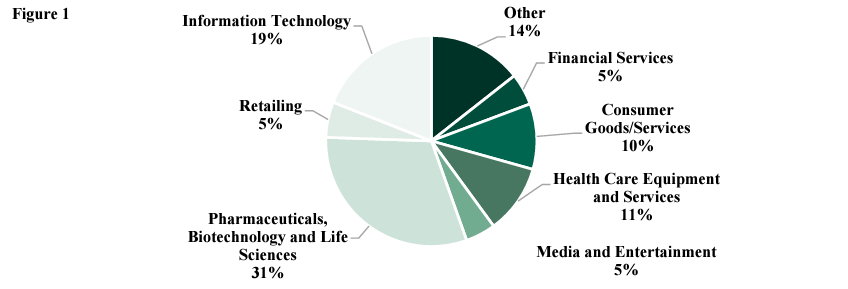
As we continue our IPO-related Viewpoint series, we note the marked reduction in the number of traditional or SPAC-related initial public offerings (IPO) in 2022 when compared to 2021 IPO-activity. For a variety of reasons, 2022 has been a challenging year in the market and particularly within the industries that are traditionally heaviest in terms of public offerings ¾ biotech and high tech. This article focuses on understanding practices related to equity awards made at or around IPO. More specifically, we examined the prevalence and timing of IPO grants, the type of equity vehicles used, and the size of IPO award pool among 400+ IPOs from January 1, 2021 through December 31, 2021. Further, we analyzed the data for notable differences based on industry. See Figure 1 for a breakdown of the types of industries included in our review.
Our research indicates that ~60% of companies that went public in 2021 granted equity to employees within the three months leading up to and including their IPO (for purposes of this Viewpoint, we refer to this group as “IPO awards”). Granting IPO awards can be beneficial to the company, equity recipients, and the new broader shareholder base. For the company, equity grants help facilitate the motivation and retention of key talent through a time of exciting considerable change. Such awards are also essential when a company seeks to hire key talent who will be critical to the future success of the newly public company. For employees, in addition to providing recognition for contributions toward a significant milestone and celebrating the private-to-public transition, they provide an initial or increased opportunity to become owners in the company. For shareholders, they provide direct alignment between management and shareholders, as the IPO price serves as a common baseline for aligning management’s rewards and shareholder returns.
While the practice of granting IPO awards is relatively common, the decision to provide these awards depends on several factors, including:
- Current equity awards outstanding and shares available for future use prior to the IPO
- Current and potential dilutive impact to existing and newly public shareholders
- Timing of the last equity award prior to IPO
- Percentage of unvested equity and the perceived holding power
- Available share pool reserve and projected equity award needs to attract, motivate, and retain talent
In addition to making a go/no-go equity grant decision, companies need to consider several important program features:
- Eligibility
- Award size (by individual and in aggregate)
- Award design features:
- Equity vehicle and/or mix of equity vehicles
- Vesting and/or performance provisions
- Termination provisions
Further, from a design perspective, companies also need to determine if the IPO awards should differ materially from the go-forward, long-term incentive (LTI) strategy. For example, should the IPO awards cover a broader employee population than the anticipated annual cycle award program, or should the type of equity vehicle and vesting provisions be unique to distinguish such awards from previous or expected future awards? We note also the importance of adhering to a reasonable and defensible equity valuation process, particularly for those making equity awards before their IPO, in order to mitigate the risk of any “cheap stock” issues with the SEC.
Summary of Key Findings [1]
Our research of IPO equity practices revealed the following key findings:
Prevalence and Timing of IPO Grants
- Out of 368 companies that went public in 2021, 62% granted equity awards around the timing of their IPO. (See Figure 2)

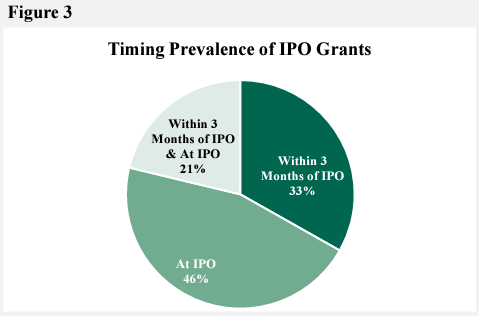
- Among the companies that granted IPO awards, 46% made a grant at IPO, while 33% made a grant within three months of their IPO and 21% did both (granted awards at IPO and within three months of their IPO). (See Figure 3)
Size of Award Pool as a % of FDSO and % of Total Share Reserve
- In order to provide two perspectives on the size of IPO equity award pools, we analyzed the award pool as a percentage of Fully Diluted Shares Outstanding (FDSO) [2] and as a percentage of the Total Share Reserve.
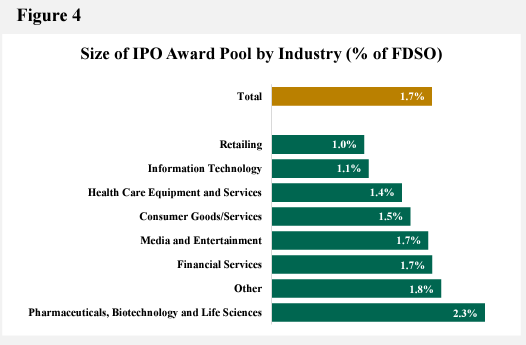
- IPO Award pools as a percentage of FDSO were 1.7% at median, with a difference in pool size ranging by industry (range of 1.0% to 2.3%).
- Pharma, Biotech, and Life Sciences companies granted the highest percentage of FDSO at 2.3% at median, while Retailing and Technology companies had the lowest, 1.0% and 1.1%, respectively. (See Figure 4)
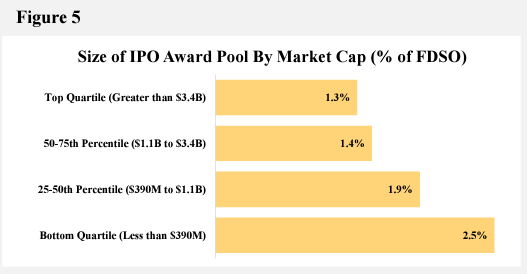
- To no surprise, smaller market cap companies (<$390 million) had the highest award pool as a percentage of FDSO (2.5% at median) and companies with larger market caps had the lowest (1.3% to 1.4% at median). (See Figure 5)
- When reviewing IPO award pools, as a percentage of the Total Share Reserve 18.6% was the median, with a significant difference in pool size based on industry (9.3% to 41.0%). (See Figure 6)

- Media and Entertainment industry companies granted the highest percentage of Total Share
Reserve with a median of 41.0% (the average for this industry was 41.1%); however, there were less than 10 companies in this industry group
Type of LTI IPO Grants
- The most common type of equity award granted by companies in connection with an IPO is a stock option. (See Figure 7)
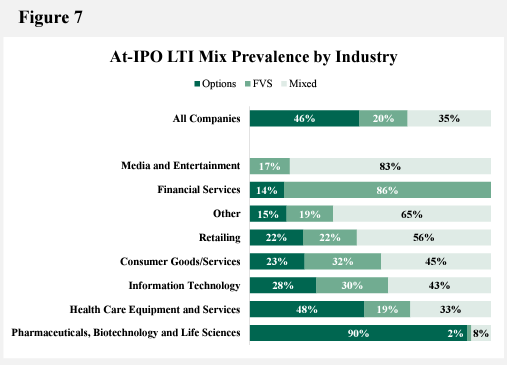
- At-IPO award types varied considerably by industry, with Pharma, Biotech, and Life Sciences companies overwhelmingly granting stock options and Financial Services companies mainly granting full value shares (e.g., restricted stock/units).
- Other industry sectors granted a mix of stock options and full value shares.
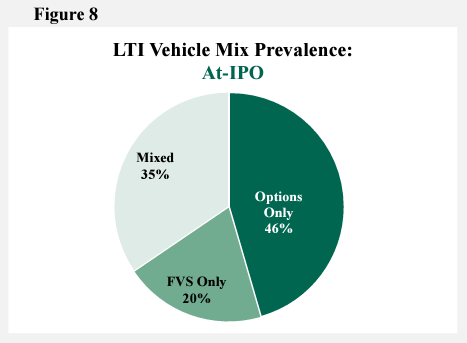
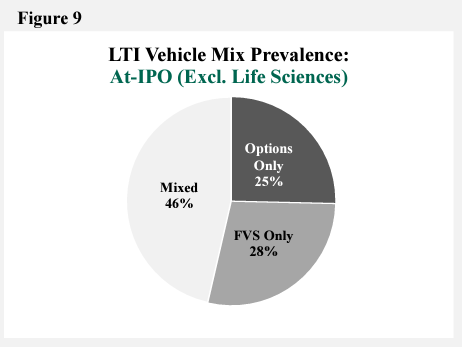
- When reviewing the equity mix of vehicles At-IPO with and without Pharma, Biotech, and Life Science companies, there is a significant decline in the use of stock options. For example, the prevalence of granting At-IPO awards are 46% stock options, 20% full value shares, and 35% for both stock options and full value shares when all industries are included. (See Figure 8) However, when Pharma, Biotech, and Life Science companies are excluded, the prevalence of only granting stock options drops to 25% and granting a mix of stock options and full value awards increases to 46%. (See Figure 9)
- In our experience, while there has been some recent movement on this, the traditional approach among Pharma, Biotech, and Life Science companies is to maintain an all-stock-option grant strategy up until there is progress toward commercialization (e.g., after clinical progress/FDA success and commercial prep has begun) when stock price volatility and growth trajectory has somewhat stabilized.
Conclusion
The IPO market has slowed down considerably given market turmoil, inflation, higher interest rates, continued supply chain issues, recession concerns, and general economic uncertainty. In hindsight, the 2021 IPO market on which our analysis is based may be the most robust market we will experience for years to come. As such, we believe the IPO practices captured by this research provides a great framework for IPO planning for at least the next 2-3 years.
There are also some LTI design takeaways, especially the potential consequences of heavily relying on stock options to provide long-term incentives, and the need to maintain sufficient equity reserves to adapt to changing conditions. While hindsight is always 20-20, the significant reliance on stock options among 2021 IPO companies may be having significant employee motivation and retention implications with falling stock prices, especially within certain industries. Lower stock prices also means far more shares will be required to provide employees with comparably valued equity awards, although some companies may opt to grant a similar number of shares but do so in full value shares.
Endnotes
1This Viewpoint is based on analyzing IPO-related equity grant practices for 368 companies; 42 companies that went public in 2021 were removed from Pay Governance’s research due to insufficient data reported about the companies’ equity plans and grant practices.(go back)
2FDSO: sum of common shares outstanding, equity awards outstanding, and remaining in reserve (for purposes of this Viewpoint, we have not included warrants or other convertible securities).(go back)