 Print
PrintSubodh Mishra is Global Head of Communications at Institutional Shareholder Services. This post is based on an ISS Corporate Solutions memorandum by Paul Hodgson, Senior Editor; Aditi Aier, Senior Associate; and Carmen Luk, Senior Associate at ISS Corporate Solutions. Related research from the Program on Corporate Governance includes Politics and Gender in the Executive Suite (discussed on the Forum here) by Alma Cohen, Moshe Hazan, and David Weiss; Will Nasdaq’s Diversity Rules Harm Investors? (discussed on the Forum here) by Jesse M. Fried; and Duty and Diversity (discussed on the Forum here) by Chris Brummer and Leo E. Strine, Jr.
There has been a lot of talk about how to increase racial and ethnic diversity on U.S. corporate boards as well as many initiatives to help nominating committees identify candidates from under-represented groups. To assess the current situation, ISS Corporate Solutions took a look at the diversity trend in the Russell 3000 over five years, with a special focus on Black/African American directors in recognition of Black History Month.
Key Takeaways
- For the first time, minority directors occupy more than 20% of board seats among Russell 3000 companies
- Black/African Americans saw the highest increase in directorships, a rise of more than 90% between 2019 and 2023
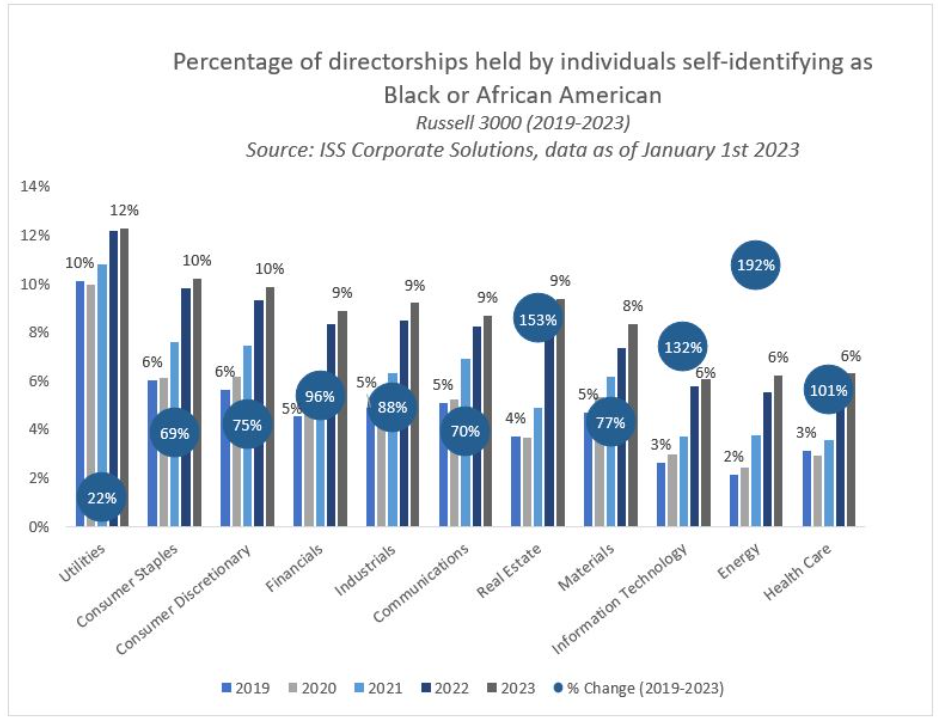
- There were significant increases in Black/African American representation across all industries except Utilities, a sector that has long seen the highest Black/African American representation
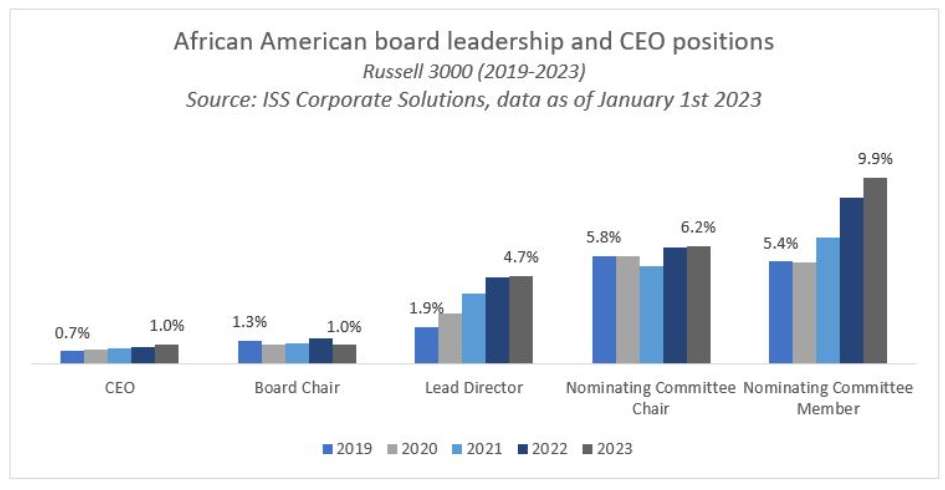
- Black/African American CEOs and board chairs continue to be extremely rare, at around 1% of the total
The proportion of Caucasian/White directors in the Russell 3000 declined by 9% during the period falling below four-fifths for the first time. At the same time, the proportion of directors from minority groups, including Black/African American, Asian and Hispanic/Latin American, increased. While the changes were large in some cases, the proportion of minority-held directorships grew by only a percentage point or so in most years. Native American/Alaskan Native/Native Hawaiian directors continue to represent the smallest proportion of directors among minority groups. Black/African American directors have overtaken Asian directors in percentage terms. The pace of change for Black/African American directors began to accelerate in 2021 during the pandemic and in the wake of Black Lives Matter movement.

Black/African American directors have seen significant increases across all sectors except Utilities. However, the sector had the highest proportion of Black/African American directors over the entire period and still continues to lead the way. Consumer Staples and Consumer Discretionary sectors are beginning to catch up.
The Energy and Real Estate sectors show the largest increases at 192% and 153%, respectively. However, Energy had the lowest level of Black/African American directorships in 2019, so the large increase comes from a low starting point. Even after the increase, Energy remains the ”whitest” sector, with 84.9% of directorships being held by Caucasian/Whites, followed by Real Estate and Financials at 82.3% and 81.6%, respectively.
Black/African American CEOs and board chairs are still extremely rare, at around 1% in each of the years in the study. While there was a small increase over the period, the number of board chairs fluctuated, ending in a slight decrease by 2023. The proportion of Black/African American lead directors, however, more than doubled in this period.
The proportion of Black/African American nominating committee members increased from 5.4% to 9.9%, which may result in wider access to a network of Black/African American candidates. While still only a small minority, the group’s nominating committee chairs also increased modestly from 5.8% to 6.2%.
The data are based on the number of directorship roles in the Russell 3000, rather than the total number of directors, so some individuals who hold multiple board posts will have been counted two or more times. Directors whose ethnicity/race was not disclosed or was unknown were excluded from the analysis. It’s worth noting that the number of these unknown/undisclosed directors decreased by 58% over the period and accounted for less than 3% of all director positions sampled in 2023. That demonstrates that more and more companies are disclosing directors’ ethnicity and race. This change was likely driven in large part by the recent NASDAQ disclosure rule, which requires companies to publicly and annually disclose board-level diversity statistics using a standardized template. The data for each year covers the 12 months to January 1.