Click to Download: ESG A Valuation Framework
Overview
It started sometime last year, during the fourth quarter. The morning business show Squawk Box began to mention “ESG” on a daily basis. Sometimes it was one of the hosts, sometimes it was a guest. Then. there were two inflection points that marked a higher level of discourse. First, on December 17, 2019, SEC Commissioner Hester Peirce went on live television to call for greater oversight of how ESG is used by companies and the investment community. “
The notion that we can come together and we can get our regulator to focus on an amorphous set of qualities other than the long-term financial value of a corporation, I think we’re fooling ourselves,” said Commissioner Peirce on CNBC’s Squawk on the Street.
At the time, more than $17 billion had been invested into sustainable-focused exchange-traded funds (ETFs) and open-end funds during 2019. In 2018, the number was about $5 billion. “The first issue is that we don’t even know what ESG means,” Peirce continued. As more and more ESG investing happens, there will be more and more scrutiny as to how a fund defines its ESG qualifications. Pierce added “Not only is it difficult to define what should be included in ESG, but, once you do, it is difficult to figure out how to measure success or failure.”
The second inflection point was triggered by the “Fundamental Reshaping of Finance” open letter to CEOs on January 14, 2020, by BlackRock Chairman and Chief Executive Officer Larry Fink. “In a letter to our clients today, BlackRock announced a number of initiatives to place sustainability at the center of our investment approach, including: making sustainability integral to portfolio construction and risk management; exiting investments that present a high sustainability-related risk, such as thermal coal producers; launching new investment products that screen fossil fuels; and strengthening our commitment to sustainability and transparency in our investment stewardship activities.”1
What does this really mean? Environmental, Social, Governance or “ESG,” is a term very few had heard of even two years ago. Today, ESG is not only a dominant topic of discussion across the American business and investment community, it is driving business decisions, impacting corporate structures and organizational charts and it is having a profound impact on investment decisions. Further, the recent global pandemic and economic crisis has accelerated the drive by companies to establish ESG programs, and report ESG metrics as they seek ways to attract investment capital and demonstrate rigorous ESG risk management in their organizations.
What has remained elusive for businesses and investors is a way to quantify the actual and potential risks, losses, benefits, and rewards associated with ESG decisions. Corporate leaders and boards have been missing a way to tie ESG to valuation. How do you justify making substantial investments and fundamental changes to corporate structures and culture without empirical evidence that it will make a direct impact on shareholder value, total shareholder return, net present value, and individual rates of return?
These are fair questions. Do ESG programs impact firm value? If they do, how exactly can the valuation impact be measured? What will need to be addressed by regulators that could allow this valuation impact to be reported? Will ESG assets be recorded on balance sheets one day soon, just as intangible assets such as goodwill and intellectual property are recorded today?
Generally speaking, pre-COVID, the goal of ESG risk management was to minimize negative events that might impact value. That said, this lens of due diligence has changed how the market invests.
As it pertains to the energy sector, the weight energy carries in various indices has gone down significantly in the last few years. Clients are asking investors to keep their money invested in ESG compliant portfolios and think that fossil fuel-based companies contradict this investment thesis. A factor of investment in the market is based on sentiment and belief in performance. If investors are more comfortable in ESG funds, then more people will keep their money invested in them.
That leads to another interesting aspect: the psychological factor. Given the benefits of ESG, investors are geared behaviorally to allocate their investments towards these funds. As companies continue to legitimately integrate ESG into business strategy, the ability to achieve “alpha,” which is an excess return or performance above a codified index or peer group, might become more difficult to do.
While we might not have an answer right now about the regulatory aspects of ESG reporting, this paper will introduce analytical methods for providing valuations of ESG performance. Our framework is objective and designed to serve all constituents. But even before we get to that, there are two essential steps that must be completed first. Before you can value something, especially something that is intangible, you must define it. After it is defined, it must be measured in a way that is transparent, auditable, and objective. Finally, the valuation should utilize vetted, established, and customary valuation techniques and metrics that have been used for years to value businesses and assets for decades. There is no need to “reinvent the wheel.” We can value ESG assets and their impact on a business today.
Define
It is difficult to measure and value things that are not well defined. While many might know that ESG stands for Environmental, Social, and Governance, that is often where the knowledge ends. Fixed definitions are hard to come by, and the scattering of websites, scorecards, speeches, podcasts, and white papers that mention ESG in many different ways do not help. There are, however, certain established and respected frameworks that can and should be used now. The most well-developed thus far is the one published by the Sustainability Accounting Standards Board (“SASB”).
SASB is a nonprofit organization founded in 2011 by Dr. Jean Rogers,2 SASB’s first Chief Executive Officer. The roots of the SASB framework are based on a 2010 academic white paper written by Dr. Rogers, along with Steve Lydenberg, who was then the Chief Investment Officer of Domini Social Investments, and Dr. David Wood, who was then Director of the Initiative for Responsible Investment at Harvard University. The paper, entitled “From Transparency to Performance: Industry-Based Sustainability Reporting on Key Issues,” was drafted to establish standards to be used in Securities and Exchange Commission (“SEC”) filings, such as 10Q or 10K reports. The authors wanted to propose a methodology that would help investors, regulators, and analysts to understand specifically how individual companies and companies in funds compared in terms of social and environmental goals and issues.
The name SASB is no coincidence. It was devised to sound like “FASB,” the Financial Accounting Standards Board. The FASB originated in the summer of 1973 to organize and codify the US Generally Accepted Accounting Principles, (“GAAP”), are used by American companies, in conjunction with the American Institute of Certified Public Accountants, the “AICPA.” The SEC provided its imprimatur later that year, which gave the FASB and its research, pronouncements, and guidelines substantial weight and credibility. In other words, in the US, the FASB makes the accounting rules that public and private companies use so that their financial statements are rules-based and consistent.
SASB3 seeks to replicate what FASB does by creating a set of clear disclosure standards broken out by environmental, social, and governance topics, and by industry. At the heart of the SASB framework is its “Materiality Map®” or “Map.” Eleven industry groups are shown across the top, from Consumer Goods to Transportation. Along the left-hand side of the Map are the 26 sustainability issues that the SASB has identified and selected which can be expected to impact financial statements and the operating performance of a company. They are summarized here, as referenced directly from the SASB website:4
Environment
- Greenhouse Gas “GHG” Emissions
- Air Quality
- Energy Management
- Water & Wastewater Management
- Waste & Hazardous Materials Management
- Ecological Impacts
Social Capital
- Human Rights & Community Relations
- Customer Privacy
- Data Security
- Access & Affordability
- Product Quality & Safety
- Customer Welfare
- Selling Practices & Product Labeling
- Human Capital
- Labor Practices
- Employee Health & Safety
- Employee Engagement, Diversity & Inclusion
Business Model & Innovation
- Product Design & Lifecycle Management
- Business Model Resilience
- Supply Chain Management
- Materials Sourcing & Efficiency
- Physical Impacts of Climate Change
Leadership & Governance
- Business Ethics
- Competitive Behavior
- Management of the Legal & Regulatory Environment
- Critical Incident Risk Management
By creating this framework, SASB seeks to “help businesses around the world identify, manage and report on the sustainability topics that matter most to their investors.”5 It is a smart strategy, because this work is happening in parallel to regulatory work that might evolve out from the Congress and the SEC. SASB has developed a first mover advantage, and many companies and investor funds are already using the framework today. BlackRock, mentioned above, publishes a SASB disclosure document, easily downloaded from its website.6 This very disclosure document highlights the fact that a company’s bottom line and its brand can be impacted measurably by environmental and social indicators. There is growing empirical evidence provided by academics, institutional investors, and consulting firms that has confirmed this. Most recently, $1 of every $4 dollars is invested in the US today under an ESG/ SRI label. In our view, it will be SASB and its framework that will drive this narrative.
In addition to SASB, there are two other organizations that should be noted in this context. One of them is the Financial Stability Board (“FSB”) Task Force on Climate-related Financial Disclosures (“TCFD”), created in 2015. TCFD’s stated mission is to “develop voluntary, consistent climate-related financial risk disclosures for use by companies in providing information to investors, lenders, insurers, and other stakeholders. The Task Force will consider the physical, liability and transition risks associated with climate change and what constitutes effective financial disclosures across industries. The work and recommendations of the Task Force will help companies understand what financial markets want from disclosure in order to measure and respond to climate change risks, and encourage firms to align their disclosures with investors’ needs.”7
According to the TCFD, climate risk is financial risk that is non-diversifiable and can impact corporations through revenues, expenditures, assets and liabilities, and capital and financing. In 2017, TCFD released its report outlining recommendations for reporting climate-related risks. It organized those risks into the following categories:
Transitional Risks
- Policy and Legal
- Carbon pricing and reporting obligations
- Mandates on and regulation of existing products and services
- Exposure to litigation
- Technology
- Substitution of existing products and services with lower emissions options
- Unsuccessful investment in new technologies
- Market
- Changing customer behavior
- Uncertainty in market signals
- Increase cost of raw materials
- Reputation
- Shift in consumer preferences
- Increased stakeholder concern/negative feedback
- Stigmatization of sector
Physical Risks
- Acute: Extreme weather events
- Chronic: Changing weather patterns and rising mean temperature and sea levels
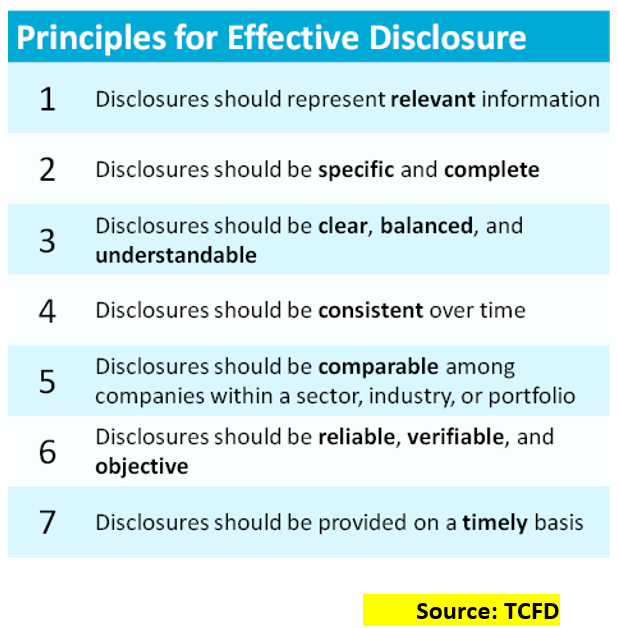
TCFD’s recommendations are organized around four areas that represent how organizations operate: governance, strategy, risk management, and metrics and targets. TCFD provides recommended disclosures for these four areas and guidance on how to implement the recommendations for the financial sector ( banks, insurance companies, asset managers, asset owners) and the non-financial sector (energy, transportation, materials and buildings, and agriculture, food and forest products). It also provided a list of principals for effective disclosure.
TCFD disclosures provide transparency to the financial community on the climate-related risks a company faces. This is important because it gives the markets a realistic assessment of those risks. A key component of disclosure is demonstrating mitigation measures and efforts. When the financial community understands those risks in terms of impacts and ability and willingness to mitigate, it rewards those companies most organized and committed to mitigating those risks. By providing rigorous assessment of risks, including scenario planning, and by demonstrating forward thinking, actionable risk mitigation plans, companies can ease the concern financial institutions and the public sector may have for their climate-related risks.
The TCFD is critical because it is a global institution that has input from global institutions, financial and non-financial. SASB standards and TCFD recommendations are complementary. TCFD’s Implementation Annex extensively references SASB standards as an effective tool for implementing TCFD recommendations.
The United Nations’ Sustainable Development Goals (SDGs) were adopted by UN member states in 2015 as a universal call to action to end poverty, protect the planet and ensure that all people enjoy peace and prosperity by 2030. According to the UN, they are “the blueprint to achieve a better and more sustainable future for all. They address the global challenges we face, including those related to poverty, inequality, climate change, environmental degradation, peace, and justice. The 17 Goals are all interconnected, and in order to leave no one behind, it is important that we achieve them all by 2030.”8
The UN SDGs are becomingly increasingly import. Companies, especially those operating internationally, are encouraged to map their operations and performance to the SDGs and to disclose this mapping, along with SASB and TCFD mapping and disclosure.
 Measure
What good is any of this if it cannot be quantified? Eight years ago, an article in the Financial Times quoted the infamous management consultant Peter Drucker in the context of corporate reporting of ESG related topics: “What gets measured gets managed.”9 That was eight years ago! If we posit that ESG can be defined, and has been defined, and that the SASB framework will either be that which is chosen by regulators, or at the very least, play a substantial role in its definitions, then we can move on to measurement. We know what ESG is when we see it.
How do we measure it? Most observers contend that this is hard to do, even impossible. Perhaps the environmental category or “E” of ESG, can be quantified because methane and CO2 emissions, waste, water pollution, etc. can be measured volumetrically. Companies are already reporting how much they have measurably cut their GHG emissions, add it is becoming more common.10 But how do you measure the “S” and “G” components of ESG? Why is this hard to do? We have some good news. These things are not hard to measure. And we owe the solution to the “Big Data” revolution that has that has occurred, sometimes quietly, over the past several years.
What is Big Data? It’s about counting using more comprehensive and sophisticated techniques through advances in information systems. Digitization plays a key role. We live in an age where vast swaths of information have been digitized, rather than stored as paper. Digitization means that counting can be done more quickly, efficiently, and accurately. As long as the critical data needed to evaluate not just environmental categories, but the social and governance categories as well is accessible, then it can be processed and analyzed. We contend that much of this information already exists inside of companies today, but has not been organized from an ESG perspective as yet.
A comprehensive process map for this kind of work is outside the scope of this paper, but we can provide an overview of the most standard tasker flow.
- Identification – The data pertaining to a specific ESG factor needs to be located, identified, and described.
- Harvesting – The data needs to be harvested or collected.
- Complexity – The complexity of the data needs to be evaluated. This includes an assessment of its size, how it is stored, if a particular language is used, and how the data is interrelated.
- Structure – How is the data structured? Is it numerical or verbal, or both? Is it continuous or discrete? These are important things to consider when using specific tools to sort and analyze the data.
The growth of different types of tools that are used today to manage and assess data are plentiful, and include such well-established ones like R, Python, MATLAB, SQL, MongoDB, and Tableau.
Referring to a project and study one of us was involved in with a different firm, several years ago, the data was harvested from the Client’s ERP system, and R was used to organize, clean, and study the data. Sam Gafford and Derya Eryilmaz published the results of this project and study, and their outstanding work, in The Electricity Journal, back in in 2018.11
In this case, the task was to study the energy efficiency benefit for a specific product (the “Product”). We used the client’s residential customer database with 15-minute interval data for the years 2014, 2015, and 2016. These customers were spread across the Electric Reliability Council of Texas’ (ERCOT) competitive market territory. ERCOT is the entity that manages the electrical grid for about 85% of Texas customers. Depending on the product chosen and whether or not the customer received subsidies, customers were assigned to four categories. “Conventional” customers were the most common type of customer. “Budget” customers also used the product, but they received subsidies from the state. “Cash Managers” were also product users with subsidies who chose to manage their spending more actively on electricity on a daily basis. “Energy Managers” actively managed their spending on electricity like Cash Managers but were not subsidized. Once the populations were determined, two key problems were addressed. The first was the potential for a small subset of super-users to skew the averages because of the asymmetrical nature of the distributions of consumption. The second was the potential for a higher incidence of disconnections in one population group to cause us to mistake forced savings for behavioral changes.
To address the first issue, we identified several extreme energy users and excluded these outlier customers from the data, in addition to the customers who dropped the product in each year. An outlier customer was defined as a residential customer whose daily energy consumption was an order of magnitude greater than the median of the energy usage of the sample.
To address the second issue, we eliminated all zero-usage intervals when measuring the average usage for that interval by each population. However, by eliminating zero-usage intervals from the averages, we could count only the customers who were on-flow and be assured that any energy efficiency found would be independent of disconnections.
Self-selection happens when customer choice for a given product is not truly random. Because the client operated in a competitive marketplace, the product choice was not random and was not controlled. Because of the features of the product, we expected it to appeal particularly to consumers who were credit-challenged. We selected a random sample of the conventional customers, who were the most numerous. We employed power analysis in R to determine the appropriate sample size for the conventional customer dataset to yield statistically meaningful results.
There are established methods to address self-selection bias in empirical analysis. Two commonly used methods are the “matching method” and the “instrumental variable” approach. We chose the instrumental variable approach, which assumes a strong correlation between an intermediate variable and the variable of interest, the decision to use the Product.
The instrumental variable approach is preferred mainly because, unlike the matching method which would have required us to impossibly justify and measure all determinative household characteristics, we were able to validate the instrumental variable with statistical methods. An acceptable instrumental variable was highly correlated with the Product and not correlated with the customer’s energy consumption.
For the study, we assumed the product adoption rate was highly determinative of the decision to become a product customer. Specifically, we defined customer adoption rate Adoptioni as the percentage of a given zip code’s client customers that selected the product. The adoption rate was highly correlated with the customer product preference and not directly related to customers’ energy consumption. We employed a two-stage least squares (2SLS) estimation methodology.
In the first stage of the two-stage least squares estimation, we used the Adoptioni rate to predict a customer’s product choice, which is the variable called Treatmenti,t . This variable took the value 1 for the product customers and 0 otherwise. Using the predicted Treatmenti,t from the first stage, we estimated average energy savings for Energy Managers and Cash Managers separately in the second stage of Regression Equation 1. The estimated coefficient b1 on the Treatmenti,t variable represented the average daily energy savings per customer.
We also controlled for humidity and time fixed effects in the second stage of Regression Equation 1.
First Stage:
Treatmenti,t = ao + a1 Adoptioni + a2 Humidt + φt + τi,t
Second Stage:
kWhi,t = bo + b1 Treatmenti,t + b2 Humidi,t + φt + εi,t
Where i = customer; t = day;
kWhi,t = Average daily usage of customer i on day d;
bo = Customer specific fixed effect (i.e., controlling for the customer characteristics that did not change over time such as house size);
b1 = Average daily energy savings for customers (i.e., Energy Manager or Cash Manager);
b2 = The coefficient that captures the impact of average daily dewpoint by customer zip code on average daily energy consumption;
Adoptioni = Product adoption rate by zip code (i.e., percentage). This variable was used as the instrumental variable to correct for self-selection bias;
Treatmenti,t =An indicator variable taking the value 1 if the customer was a Product customer or 0 otherwise;
Humidi,t = Average daily dew point by customer zip code that captures the humidity;
φt = Time fixed effects. This is a set of indicator variables that controlled unobserved factors that changed over time such as daily, monthly, and seasonal impacts on average daily energy consumption; and
εi,t = Identically and dependently distributed error term of the regression model.
It is important to note one limitation of this study is that we were not able include energy usage data for customers prior to becoming a product customer due to data limitations.
What happened with this fancy way of counting? The energy efficiency benefit of the product was confirmed. The most essential finding of this study is that the Product did have an energy efficiency benefit of approximately 9.6%, with an average 10.7% for conventional households, which constituted the great majority of households. This benefit was net of any reduction in consumption from disconnections. Energy efficiency stemmed from more engagement by the customer with his/her energy service. The product customer had more frequent communications about his/her usage and the associated cost, more granular information, and more real-time information. Beyond that, the product not only provided deeper information; it enabled a customer to relate his costs to his benefits in a timely and concrete financial transaction that made the communication “more real.”
The financial impact of this efficiency can be quite significant. An Energy Manager using approximately 14 MWh per year and paying 12 cents per kWh would save $183 per year from this efficiency. By way of example, if all residential customers in Texas switched to the Product, the savings would top $800 million per year if all residential customers realized a 9.6% efficiency benefit. Besides the energy savings, the efficiency could lower peak capacity requirements, meaning fewer expensive peaker plant generators would need to be maintained in the generation stack, which is also an area of future research. What if the 9.6% efficiency benefit comes out of coal? What is the emissions impact of this one simple product? How does this look from an ESG perspective?
Value
As ESG issues increasingly impact the financial performance of companies, there has been little agreement on how they impact valuation. Moreover, financial data, such as accounting statements, often do not provide the level or type of information needed to make sure that defined and measured objectives are appropriately considered. Such considerations inevitably lead to one central question: how do analysts or objective observers assign a proper valuation to a specific company, adjusted for ESG metrics? The good news is that now that ESG has become more mainstream, ESG metrics used in conjunction with more traditional financial metrics is making it easier to assess the ESG profile of a company, including its overall impact on valuation. For some C-Suite management teams and Board room executives, having the ability to assess valuation enhancements through specific ESG criterial becomes the most critical factor in deciding whether that company decides to implement an ESG program at all.
The first iterations of ESG metrics and investment criteria took a blunt and mundane approach to sustainable investing, by excluding controversial factors and issues or by aiming to deliver a particular benefit or impact. That is not necessarily the case anymore. Now that ESG has become more mainstream, just over the last 18 months, metrics have become more sophisticated and often make quantitative assessments in understanding what those metrics means. It is now possible to apply ESG considerations across a company’s activities and to quantify a defendable valuation of the ESG impact.
For example, in looking to the midstream industry, there are a set of metrics that can be used now to quantify ESG aspects of firm value. This industry generates significant quantities of greenhouse gases and other air emissions from compressor engine exhausts, oil and condensate tank vents, natural gas processing, and fugitive emissions, in addition to emissions from mobile sources. Air pollutants can have significant, localized human health and environmental impacts. At the same time, the management of fugitive emissions of methane (CH4), a potent greenhouse gas, has emerged as a major operational, reputational, and regulatory risk. Financial impacts on midstream companies will vary depending on the specific location of operations and the prevailing emissions regulations, and will likely include higher operating or capital expenditures and regulatory or legal penalties. Companies that capture and monetize, or cost-effectively reduce emissions by implementing innovative monitoring and mitigation efforts and fuel efficiency measures, could enjoy several benefits. These companies can reduce regulatory risks and realize operational efficiencies in an environment of increasing regulatory and public concerns about air quality and climate change, both in the U.S. and globally.
Specific financial impacts on midstream companies from their GHG and other air emissions could be of three types: 1) additional costs from regulations of GHGs or air emissions that aim to internalize the societal costs of emissions, 2) potential for generating additional revenues from capturing and selling GHGs like carbon dioxide and methane or generating electricity from methane, and 3) cost savings from enhanced fuel efficiency. All of these elements impact cash flow, which is the core driver of the Income Method of valuation.
Facilities in petroleum and natural gas systems are required to report emissions from combustion, venting, equipment leaks, and flaring. Given the significant contribution of petroleum and natural gas systems to global GHGs and other harmful air pollutants, the EPA introduced rules in 2012 for oil and gas companies to reduce emissions. These include, for example, requirements for new storage tanks at compressor stations to reduce volatile organic compound emissions by at least 95%. Similarly, state-level legislation and regulations can also affect operations of midstream companies with significant GHG and other air emissions. As a result of California’s AB32 cap-and-trade system, several midstream facilities, including compressor and storage stations, are required to reduce emissions or buy carbon credits (or permissions to emit) from the market. Both reduction of emissions and purchase of credits pose additional costs to the industry. Regulations in this area are also constantly evolving, creating operational risks for the industry. For example, California is also conducting field measurements of fugitive methane emissions from natural gas distribution pipelines. The results of the study are expected to inform the cost-effectiveness of developing regulations specific to fugitive GHG emissions from these operations. Violations of air emissions rules can lead to regulatory fines and penalties, including additional measures to control emissions that may entail increased operating costs or capital expenditures.
What is most salient in the context of valuation is that companies with significant GHG emissions could also face a higher risk profile, and therefore cost of capital, due to the uncertain nature of future (likely more stringent) GHG regulations. In particular, growing concern over methane leakage are likely to increase future regulatory risks. The probability and magnitude of the impact of GHG emissions and other air emissions on financial results in this industry are likely to increase in the medium term.
More and more work is being done on the valuation aspect of ESG. Two important papers use a top-down approach. “ESG in Equity Analysis and Credit” analysis was published in 2018 by the PRI, the Principles of Responsible Investment arm of the UN, and the CFA Institute.13 Less than a year ago “Foundations of ESG Investing: How ESG Affect Equity Valuation, Risk, and Performance” was published in the Journal of Portfolio Management.14 Both papers, and there are others, proceed down a path that identifies quantified value enhancements at the company level from ESG programs. They are top-down and address this issue from the perspective of risk. They combine elements of the Income Method, which is cash flow based, and the Market Method, which is based on comparative analysis. These approaches can be distilled into one central concept: adjusting the discount rate.
Obviously the lower the discount rate, the higher the valuation, all other items held constant. Adjustments to Beta can accomplish this. Beta measures systemic risk, and the performance of a company as compared with a broad index like the S&P 500 or the Russell 2000. There are also methods to use Beta to assess a private company, if the Guideline Public Companies selected for the analysis, the “comps,” are chose properly. For example, in a recent valuation we completed, the mean unlevered Beta of a group of 10 comps was 0.58. The re-levered Beta for the private company we were valuing was 0.56. But absent an assessment of the ESG components and metrics of the 10 comps, one by one then taken as a whole against the S&P 500, there was no way to adjust the Beta with adequate support.
Using Alpha, however, it could be done. Alpha is an adjustment made to the Capital Asset Pricing Model (“CAPM”) as part of the calculation of the Weighted Average Cost of Capital, or “WACC.” Alpha is unsystematic risk, unique to the firm undergoing valuation. It is here that a specific adjustment can be made for ESG value. As shown below, if the aggregate fair value of the company’s ESG program is 150 basis points, then the Alpha is reduced from 5% to 3.5%. The valuation increases from $263.9 million to $271.5 million, implying that the hypothetical ESG program is worth almost $8 million.

But how do we support the adjustment to Alpha? The time has come for ESG to be seen as an asset that can be defined, measured, and valued.
According to the CFA Institute, “Intangible assets are increasingly critical to corporate value, yet current accounting standards make it difficult to capture them in financial statements. This information gap can affect valuations for the worse.”15 The authors were not even talking about ESG Intangible Assets, or the potential for the identification and separation of ESG intangibles in the near term. Their article provides and overview of intangible asset valuation and its challenges.
Intangible Assets lack physical substance but are not financial assets. According to the International Glossary of Business Terms,16 Intangible Assets are, “non-physical assets such as franchises, trademarks, patents, copyrights, goodwill, equities, mineral rights, securities and contracts (as distinguished from physical assets) that grant rights and privileges, and have value for the owner.” Brand can be an Intangible Asset as well, and the value of a brand can be enhanced if the brand is associated with ESG programs. The problem is that U.S. GAAP only allows Intangible Assets to be recorded in a balance sheet if they have been acquired. But regardless of when or if this might change one day, the valuation techniques that are used to value intangible assets can be used to value the impact of ESG on a company’s total value.
There are several methods that can be used to fairly value intangible assets, and we will look at five. The first is the Relief from Royalty Method, or RRM. With this technique value is calculated by using hypothetical royalty payments that would be avoided by owning an asset rather than have to pay for it via a license. We use the RRM most of the time to perform valuations of trade and domain names, trademarks, software, and certain types of R&D. It is unlikely that RRM can be used to value ESG at this time, there is not enough data available yet to isolate what a real royalty rate might be for that can be tied to a specific revenue stream and where data on royalty and license fees from other market transactions are available.
The Multiperiod Excess Earnings Method, (“MPEEM”), has more promise. It is an income approach, using discounted cash-flow analysis. But instead of using the whole entity’s cash flow, with the MPEEM we will isolate the cash flows that we can prove are driven by specific ESG factors. Usually the MPEEM is used for an intangible asset that is the main driver of a company’s valuation, but that does not have to be the case. We often use it for customer and client related assets, but again, ESG is a new area of study and the MPEEM should not be ruled out.
A third approach is called “with and without,” or the Differential Income Model (“DIM”). With this technique we value the company, and then revalue it with any and all ESG related factors removed. The difference in fair value equates to the fair value of the ESG program.
Real Options modeling can also be used to value intangible assets and is most often a technique that lends itself to value that will accrue in the future, with some uncertainty. For example, patents might have no value today, but could be very valuable in the future if developed. Pharmaceutical intangibles are often analyzed this way.
Lastly, “Replacement Cost Method Less Obsolescence” can be used for intangible asset valuation, by calculating the replacement cost for the intangible asset if it were brand new, and then applying an obsolescence factor unique to the intangible asset.
Need for Valuation Under Mandated Disclosure
ESG disclosure is, of course, currently voluntary in the U.S., though pressure is increasingly mounting for larger, publicly traded companies to disclose. The lack of uniformity in ESG disclosures is a criticism that is being voiced by the financial community, by regulatory bodies, activist groups, politicians and even by companies that are expected to disclose. That lack of uniformity and a general belief by certain constituents and policymakers that great disclosure transparency is needed generally, is creating momentum for mandated ESG reporting.
In 2019, the House Subcommittee on Investor Protection, Entrepreneurship and Capital Markets held a hearing on ESG. Subcommittee Chair Carolyn Maloney stated during the hearing that “ESG disclosures often aren’t as detailed as they should be” and that they “lack a legalized framework.” For that reason, she noted that they are “difficult to compare across companies.”17
More recently, ESG language has appeared twice in stand-alone legislation. It even appeared in a version of The Emergency Supplemental Appropriations Bill that would provide another round of relief for the COVID-19 pandemic. In both cases, the language would require companies receiving federal aid for COVID-19 to provide disclosures that satisfy the recommendations of the TCFD. It is unlikely that this language will be enacted into law through these bills. However, once legislative language is introduced in a comprehensive bill that is supported by a party’s leadership, like the Emergency Supplemental, it is likely to appear again in different legislative vehicles. We should expect versions of this language to appear in future legislation crafted by House Democrats.
It is important to note that in recent history there are precedents for Congress enacting legislation to strengthen financial reporting requirements when perceived weaknesses are noted by Congress and the public. In 2002, the Sarbanes-Oxley Act (SOX) was signed into law to improve the reliability of financial reporting for public companies and restore investor confidence in the wake of the Enron, Tyco International and WorldCom scandals. SOX imposed strict new requirements on accountants, auditors and corporate officers, mandating senior corporate officers personally certify that corporate financial statements “comply with SEC requirements and fairly present in all material aspects the operations and financial condition of the issuer. By knowingly signing off on inaccurate financial statements, corporate officers are now subject to criminal penalties, including prison time. Similarly, the Dodd Frank Wall Street Reform and Consumer Protection Act was enacted to further regulate the financial services community following the financial crisis of 2008. It established several new government agencies assigned to oversee provision of the Act that further regulate and restrict banking practices, lending, speculative trading, and credit ratings.
Future scandals, financial crises, and events that erode public confidence and markets could also easily result in some kind of legislatively-mandated ESG requirement. A change in the control of Congress and the White House to the Democrats could also result in such a statutory mandate. The Joe Biden Presidential Campaign endorses “Requiring public companies to disclose climate risks and the greenhouse gas emissions in their operations and supply chains” is an important tenet in the Biden Plan for a Clean Energy Revolution and Environmental Justice.18
There are numerous, recent regulatory developments impacting ESG. In December 2019, an SEC Commissioner called for greater oversight of ESG. Earlier this year, the SEC’s Investors Advisory Committee issued a recommendation to create a disclosure framework for ESG investments—specifically citing the current lack of consistent comparable data in the marketplace. That report sets the stage for the SEC to issue more consistent reporting guidelines or perhaps requirements for reporting ESG.
In July 2020, the U.S. Government Accountability Office released a report that contains an overview of issues related to public companies’ disclosures of ESG information. This report examines, among other things, (1) why investors seek ESG disclosures, (2) public companies’ disclosures of ESG factors, and (3) the advantages and disadvantages of ESG disclosure policy options. The GAO analyzed 32 large and mid-sized public companies across industries to best reflect a broad market assessment.
In June 2020, the U.S. Department of Labor (“DOL”) proposed an investment rule that that would govern how private retirement plans — particularly those under the Employee Retirement Income Security Act (“ERISA”) — should be managed with respect to ESG criteria. Recognizing the proliferation of ESG-related funds and that lack of standards for what qualifies an ESG investment, the rule proposes a requirement that priority will be given to investments that maximize financial returns, as opposed to automatically incorporating ESG ‘socially-orientated’ goals. The proposed rule states what should be obvious, that the goal and benefit of an ESG investment should be to maximize returns to the investor. It also helps mat the case for further standardization of what qualifies as ESG investment.
The notion of mandated ESG reporting requirements would have seemed a big stretch two years ago, but today they appear quite possible if not likely. Legislative and regulatory forces, a growing need for standardized practices in what constitutes ESG investments, a need for standardized ESG reporting, and a growing need by investors to understanding climate-related risks and mitigation plans are all drivers for some sort of ESG mandated ESG reporting and regulation.
The emergence of such mandated reporting and standardization further necessitates the need for ESG valuation. If such reporting is required, regulators will need to understand the market and financial impacts of such requirements, investors will need to understand the impacts of those requirements on financial factors, such as shareholder value and stock price, and companies will need to understand that impacts of required reporting and ESG reporting on their performance.
Case Study: Certified Green Energy
An example of define, measure, and value is an emerging certification process for green energy. Certified green energy is something that energy customers, traders, transporters and suppliers have been increasingly interested in for years. As companies and consumers set and seek to meet low carbon goals, the carbon-content or green value of the fuels they consume becomes more relevant.
There are examples of “mark ups” for premium products that provide a societal good when it comes to the environment, and certainly when it comes to health. The proliferation of “organic” food labeling is an example. The public is increasingly avoiding foods that use growth hormones or those that constrain animals in pens or tight quarters. There is a strong movement against genetically modified organisms, due to both health and ethics concerns. Increasingly, a certain segment of society is willing to pay a premium for foods that are labeled as organic or “non-GMO” foods. In this case, the definition and measurement has been established, and the Food and Drug Administration is the arbiter. Valuation has been set by the market-how much more does organic kale cost than non-organic kale?
The energy industry is also seeing labeling. For years, utilities and power marketers have been offering green energy alternatives that contain higher renewable content or lower carbon emissions. Lower emission transportation fuels are advertised and are being offered to certain customers. Increasingly, some customers are demonstrating a willingness to pay a premium for cleaner, greener fuels.
At the same time, companies are taking steps to analyze, disclose, and improve their ESG credentials. An important measure of ESG is disclosure of Scope 1, Scope 2 and Scope 3 greenhouse gas (GHG) emissions. Scope 1 emissions are direct emissions that come from a company’s owned or controlled sources. For instance, fuel combustion by a company as well as its vehicle fugitive emissions are Scope 1 emissions. Scope 2 emissions are emissions that come from purchased electricity, heat and steam. Scope 3 emissions are those that come from the supply chain, i.e. purchased goods and services, business travel, employee commuting, waste disposal, transportation, and distribution (upstream and downstream), etc. Green energy, consumed by companies, can improve their Scope 1 and Scope 2 emissions, and even Scope 3 emissions if they are utilized in the supply chain, thus improving ESG performance.
Green energy also creates opportunities for energy companies, all along the value chain. First, it can be deployed to win or keep market share. Second, it might be possible to charge an economic premium. And third, it can serve to improve their ESG performance, in terms of the “E” of ESG.
An example of a growing opportunity for certified green energy is natural gas. Once considered a clean-burning bridge fuel for renewables, natural gas is now being vilified as a dirty form of fossil energy. Methane, the major component of natural gas, is indeed a GHG emitter when it is released into the atmosphere. However, when it is used to create electricity and replace coal-fired generation, it is a major (if not the major) contributor to GHG reductions in the U.S. and has a much greater opportunity for contributions globally. There is a vast base of coal-fired power generation across Asia, that could be replaced with gas-fired generation.
The flaring of natural gas and venting of natural gas in the U.S. shale plays is not helping the situation. It is damaging the reputation of natural gas in the U.S. and globally. For instance, in Europe, which needs to import natural gas, governments and private sector purchasers of natural gas are looking at ways to guarantee that the gas they buy meets green standards. Companies do not want “dirty” gas from U.S. shale operations and the EU is looking at creating green standards (production and transportation data certification) for natural gas right now. Competition between U.S. LNG producers/exporters and exporters from Russia, the Middle East, and Africa is fierce.
Green gas certification could be a differentiator for American companies. There have already been some pilot programs in the U.S. for green gas labeling and transport. This work has demonstrated that certifications can be done and that transactions can take place. It is clear at this point that there is no standard for certification, but that attempts are being made to do so. There also appears to be a lack of alignment with established ESG factors, something that is would be attractive to all parties involved in a certified green gas transactions. Plus, it does not address the “S” and “G” elements of ESG.
Finally, there is a missing piece when it comes to the valuation of certified green energy. Obviously, the green energy premium will ultimately be established by supply and demand, i.e., what the buyer is willing to pay and what the seller is willing to sell it for. (Just as with organic kale mentioned above.) But other factors need to be considered on the front end of a green gas program. There needs to be an established value of the benefit that certified green gas brings to the buyer and the seller in terms of all ESG factors. That valued premium will set the state for certified green gas transactions.
There are three steps is the process of establishing a certified green energy program and marketplace, whether it is for natural gas, renewable electricity, hydrogen, renewable fuels, or other green energy products. They are:
- Define green energy: There needs to be a clear and standardized definition of each form of green energy. The definition needs to reflect the qualification of factors that make an energy form green.
- Certify green energy: A standard certification process needs to be established to certify that an energy commodity meets the criteria agreed upon for it to meet the green energy definition. This certification should be performed by a qualified third party that is attached to an academic institution and should be subject to an audit process.
- Value green energy: A valuation process should be established to determine the value of certified green energy products based on their benefit and value from an ESG perspective. That valuation should be provided by a qualified, independent valuation firm that has the requisite energy, commodity, and intangible asset valuation expertise.
ESG Standardization
It has been widely reported that one of the shortcomings of ESG, as it is currently being applied, is the lack of standardization. There need to be a set of nationally and internationally recognized standards for what qualifies and ESG performance, what constitutes a green fund or a green bond or even green energy.
With this in mind, Cornerstone and ValueScope are embarking on a collaborative research effort with The International Research Institute for Climate and Society (IRI), at Columbia University. This collaboration will focus on addressing critical ESG issues through research and implementation. It will enable Cornerstone and ValueScope to offer their clients, and other participants in this research effort, a role in establishing best practices and standards, as well as taking part in critical research and facilitated discussions that will provide the structure for successful and sustainable future of ESG principles and performance.
Conclusion
Valuation work associated with ESG might be relatively new, but the techniques and tools necessary to perform ESG valuation already exist. Both public and private companies can articulate their various ESG programs, policies, investment, and strategies using the SASB framework. Advances in data science, underpinned by widespread digitization of information, make it far easier today to measure just about anything with the right effort and process. And intangible asset valuation concepts, such that the MPEEM and DIM, can and should be applied to unique ESG cash flows. ESG valuations can be used to reconcile and support an adjustment to the CAPM, then the WACC, via Alpha. ESG is important and valuable, but it will be even more valuable when it is clearly quantified and valued using conventional and customary approaches. A DEFINE-MEASURE-VALUE approach is the right way to tackle this important and challenging issue.
About the Authors
Jack Belcher serves as a principal for Cornerstone Advisory Services. He has over 25 years of experience in energy and energy policy. Jack provides strategic and tactical advice to energy and transportation companies and financial institutions, focusing on government relations, regulatory affairs, public policy, strategic communications, situational risk management, and Environmental, Social, and Governance (ESG) performance. He is also a founder and managing Director of the National Ocean Policy Coalition. Jack previously served as executive vice president of HBW Resources, LLC, regulatory affairs and policy manager for Shell North America’s Exploration & Production Division, and staff director for the U.S. House of Representatives Subcommittee on Energy and Mineral Resources. Prior to that, Jack worked for the Independent Petroleum Association of America, Hart Energy Publications, and Texaco Gas Marketing Inc. He holds a B.A. in Government from The University of Texas at Austin.
Paul Looney services clients in the upstream, midstream and downstream sectors on government, regulatory and strategic business matters. Paul works with Cornerstone’s clients to ensure that they are compliant with federal regulatory guidelines at agencies that include FERC, DOE, EPA, DOI and with statutory requirements borne from Congressional authorization and appropriation legislation. His expertise also includes working with state and federal regulators in the permitting of large-scale energy projects including inter and intrastate pipelines, CNG and LNG facilities and upstream oil and gas projects. His experience also includes the permitting of exports, such as crude, natural gas and various refined petroleum and chemical products. Previously, Paul was executive vice president of strategic development at HBW Resources in Houston, Texas and prior to HBW, was principal and co-founder of the Washington, D.C. lobbying firm, The Washington Capitol Group. Earlier in his career, Paul served as government affairs director at the American Institute of Aeronautics and Astronautics where he worked with the firm’s corporate members in pursuing defense and energy-related regulations and legislation. Paul began his career in government service in Washington, D.C. at the U.S. Department of Interior in Congressional Affairs at the Bureau of Land Management and later served as legislative assistant to U.S. Congressman Ed Royce (R-CA). Looney holds a B.A. from the University of Texas at Austin and an M.P.A. in International Affairs from George Mason University.
Tom McNulty leads ValueScope’s Houston Office and Energy Practice. His responsibilities include financial consulting, valuation analysis, transaction and dispute advisory, and expert testimony. Tom McNulty has 25 years of experience working across the entire energy value chain. He draws on a rare combination of industry, banking, consulting, and government experience to provide his clients with transaction, financial advisory, litigation, and valuation opinion services. Tom holds the prestigious CQF (Certificate of Quantitative Finance) and FRM (Financial Risk Management) designations and received his BA from Yale University and MBA from Northwestern’s Kellogg School with various honors.
Sources:
[1] https://www.blackrock.com/corporate/sustainability
[2] https://rogersassociatesllc.com/index.php/about-me/
[3] https://www.sasb.org/
[4] https://materiality.sasb.org/
[5] https://www.sasb.org/
[6] https://www.blackrock.com/corporate/literature/continuous-disclosure-and-important-information/blackrock-2019-sasb-disclosure.pdf
[7] https://www.fsb-tcfd.org/about/#
[8] https://www.un.org/sustainabledevelopment/sustainable-development-goals/
[9] “Calls for corporate disclosure of social impact,” Ed Crooks, Financial Times, June 17, 2012.
[10] https://www.nblenergy.com/climate-change
[11] “Can a daily electricity bill unlock energy efficiency? Evidence from Texas,” Derya Eryilmaz and Sam Gafford, The Electricity Journal, Volume 31, Issue 3, April 2018, Pages 7
[12] “ESG in Equity Analysis and Credit Analysis,” Matt Orsagh, Justin Slogett, and Anna Georgieva, UN-PRI and the CFA Institute, 2018.
[13] “Foundations of ESG Investing: How ESG Affect Equity Valuation, Risk, and Performance,” Guido Giese, Linda-Eling Lee, Dimitris Milas, Zoltan Nagy, and Laura Nishikawa, the Journal of Portfolio Management, Volume 45, Number 5, July, 2019.
[14] “The Intangible Valuation Renaissance: Five Methods, “Antonella Puca, CFA, CIPM, CPA and Mark L. Zyla, CFA, CPA/ABV, ASA, CFA Institute, January 11, 2019.
[15] https://www.nacva.com/content.asp?contentid=166#terms_i
[16] https://www.brinknews.com/the-us-just-had-its-first-hearing-in-congress-on-esg-issues-whats-next-on-the-agenda/
[17] https://joebiden.com/climate/
The information presented here is not nor should it be treated as investment, financial, or tax advice and is not intended to be used to make investment decisions.
If you liked this blog you may enjoy reading some of our other blogs here.